California housing affordability climbs in first quarter 2019, C.A.R. reports
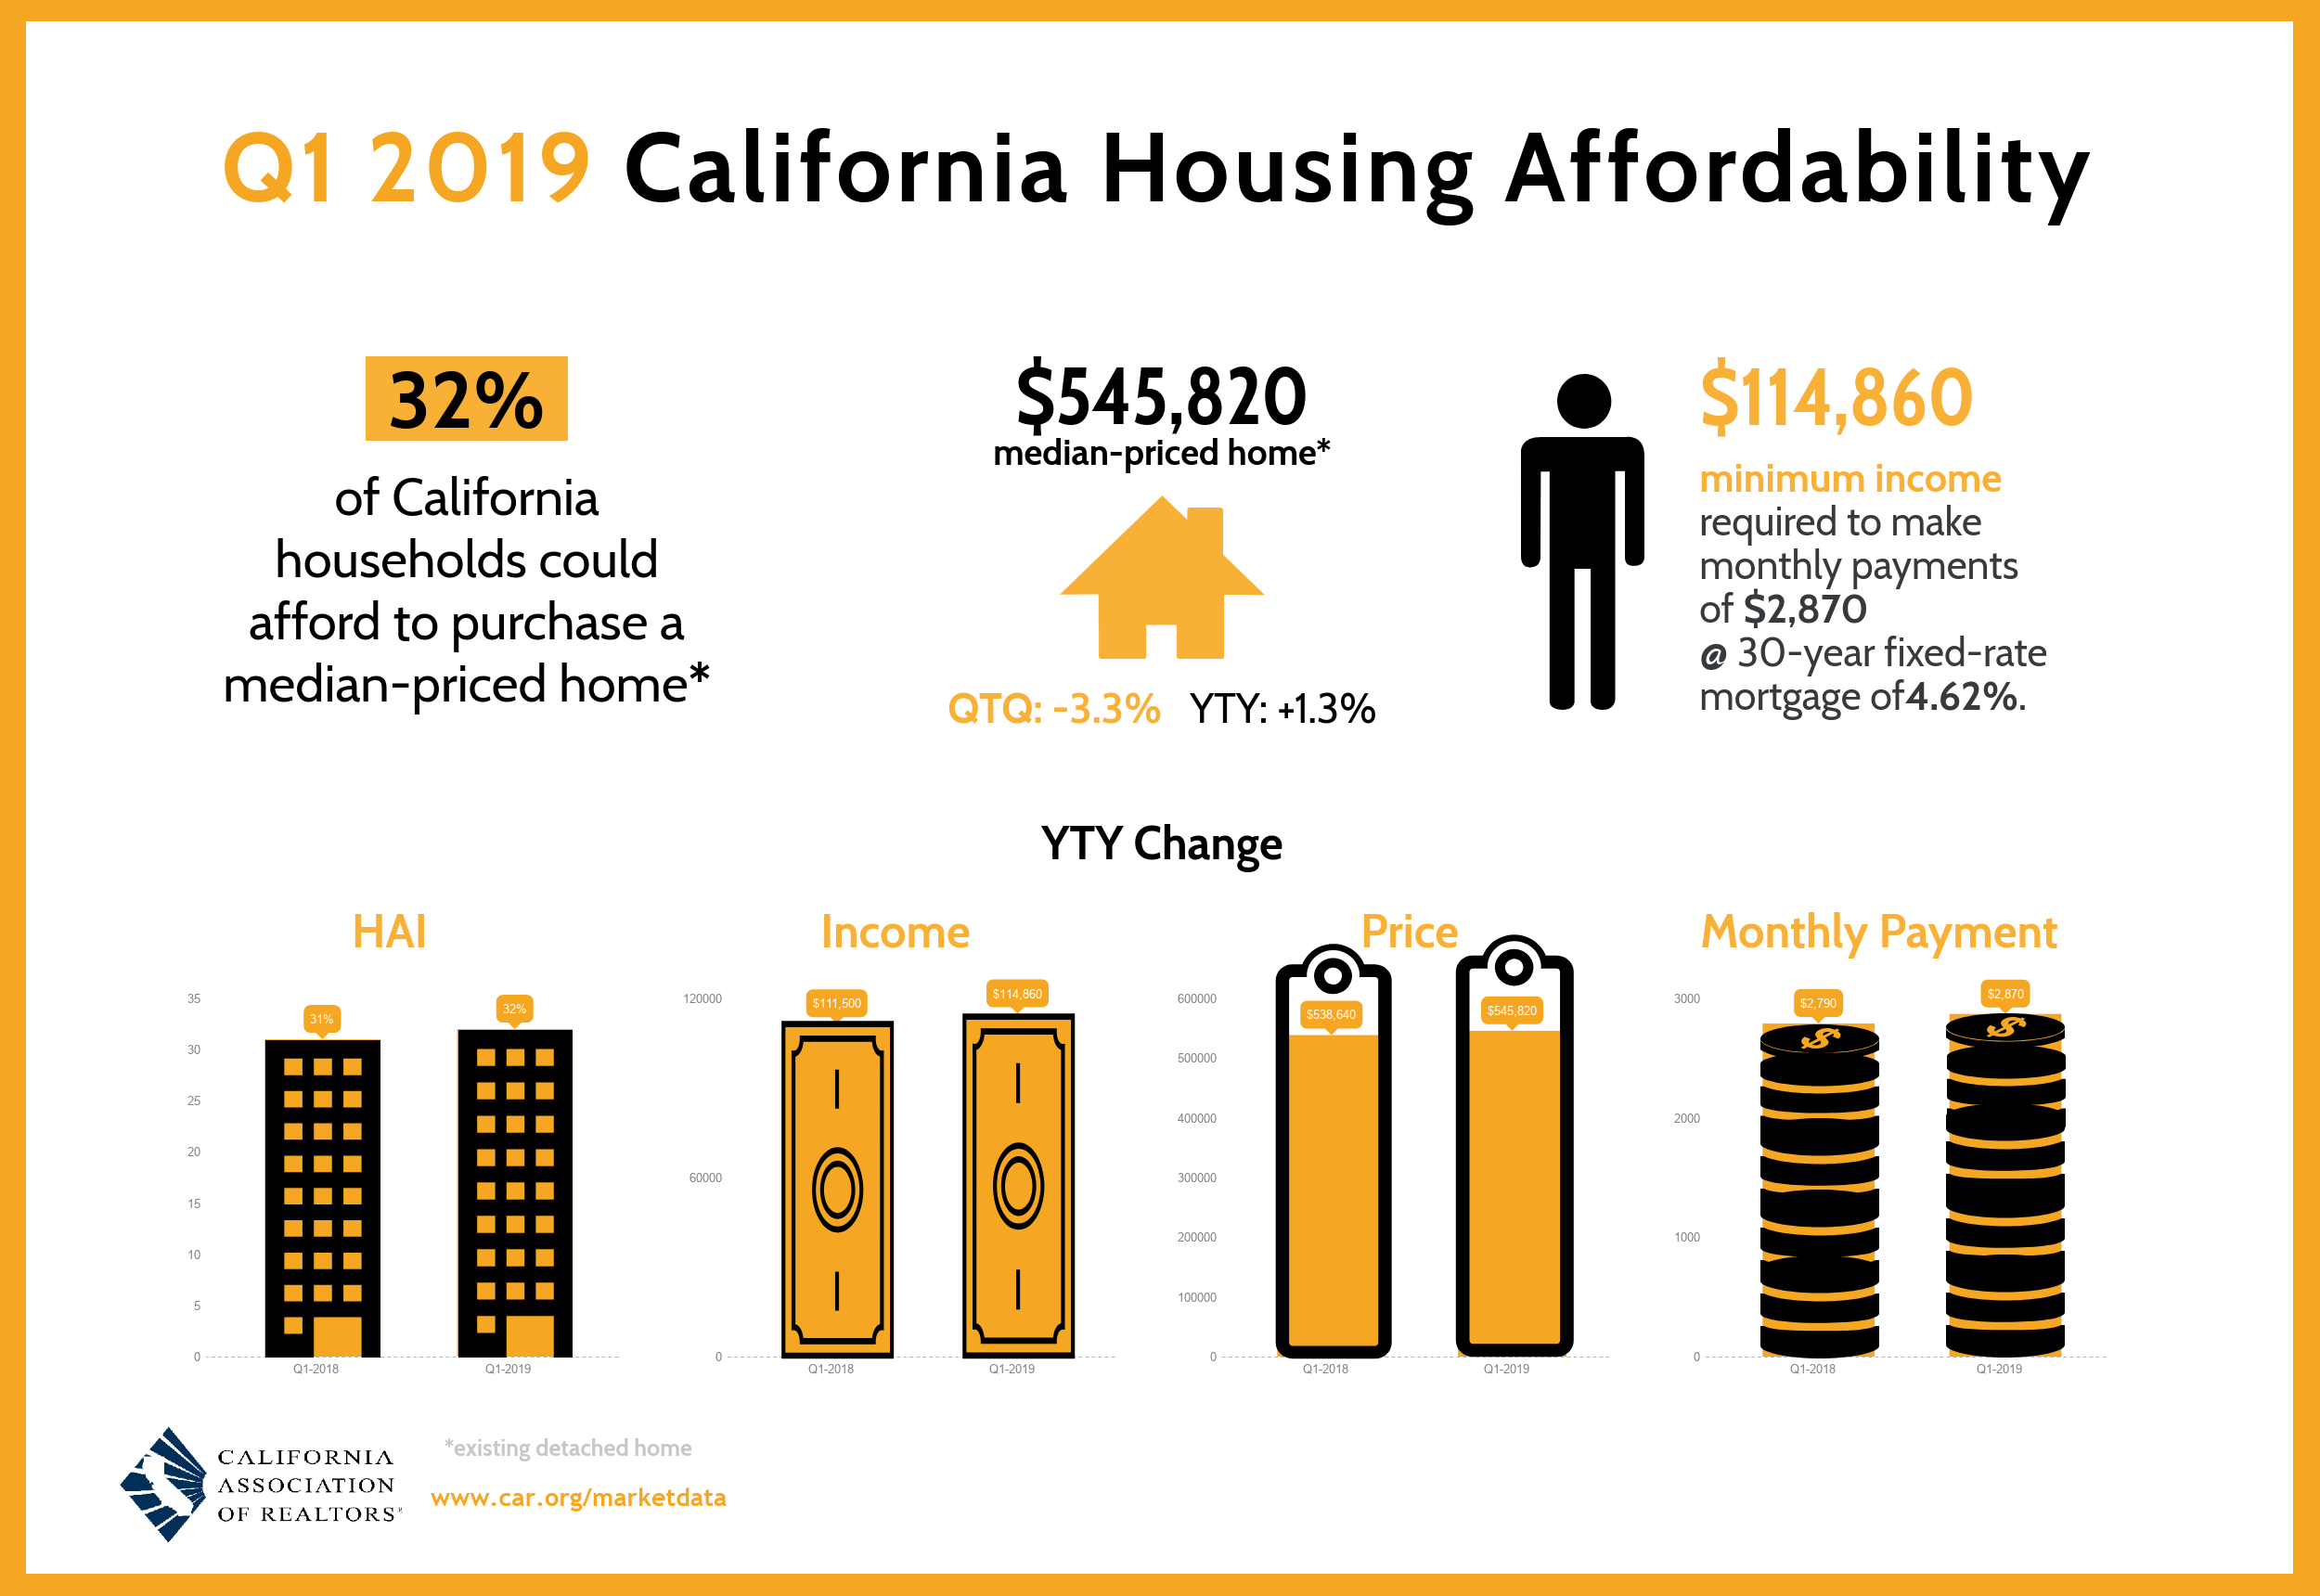
- Thirty-two percent of California households could afford to purchase the $545,820 median-priced home in the first quarter of 2019, up from 28 percent in fourth-quarter 2018 and up from 31 percent a year ago.
- A minimum annual income of $114,860 was needed to make monthly payments of $2,870, including principal, interest and taxes on a 30-year fixed-rate mortgage at a 4.62 percent interest rate.
- Forty-one percent of home buyers were able to purchase the $450,000 median-priced condo or townhome. An annual income of $94,690 was required to make a monthly payment of $2,370.
|
click to view
|
LOS ANGELES (May 14) – More Californians could afford to purchase a home in the first quarter of 2019 as lower mortgage interest rates and cooler seasonal home prices combined with higher income levels to improve California housing affordability, the CALIFORNIA ASSOCIATION OF REALTORS® (C.A.R.) said today.
The percentage of home buyers who could afford to purchase a median-priced, existing single-family home in California in first-quarter 2019 rose to 32 percent from 28 percent in the fourth quarter of 2018 and from 31 percent in the first quarter a year ago, according to C.A.R.'s Traditional Housing Affordability Index (HAI). The index climbed above 30 percent for the first time in a year. California's housing affordability index hit a peak of 56 percent in the first quarter of 2012.
C.A.R.'s HAI measures the percentage of all households that can afford to purchase a median-priced, single-family home in California. C.A.R. also reports affordability indices for regions and select counties within the state. The index is considered the most fundamental measure of housing well-being for home buyers in the state.
A minimum annual income of $114,860 was needed to qualify for the purchase of a $545,820 statewide median-priced, existing single-family home in the first quarter of 2019. The monthly payment, including taxes and insurance on a 30-year, fixed-rate loan, would be $2,870, assuming a 20 percent down payment and an effective composite interest rate of 4.62 percent. The effective composite interest rate was 4.95 percent in fourth-quarter 2018 and 4.44 percent in first-quarter 2018.
Housing affordability for condominiums and townhomes also improved in first-quarter 2019 compared to the previous quarter, with 41 percent of California households earning the minimum income to qualify for the purchase of a $450,000 median-priced condominium/townhome, up from 37 percent in the previous quarter. An annual income of $94,690 was required to make monthly payments of $2,370. Thirty-nine percent of households could afford to buy a condominium/townhome a year ago.
Compared with California, more than half of the nation's households (57 percent) could afford to purchase a $254,800 median-priced home, which required a minimum annual income of $53,620 to make monthly payments of $1,340.
Key points from the first-quarter 2019 Housing Affordability report include:
- Housing affordability improved from first-quarter 2018 in 28 tracked counties and declined in 16 counties. Affordability in four counties remained flat.
- In the San Francisco Bay Area, affordability improved from a year ago in every county. San Francisco County was the least affordable, with just 17 percent of households able to purchase the $1,532,500 median-priced home. Forty-six percent of Solano County households could afford the $430,500 median-priced home, making it the most affordable Bay Area county.
- Affordability results in the Southern California region were mixed as only Orange and San Diego counties recorded an improvement from a year ago, while San Bernardino and Ventura counties experienced a decline. Affordability was unchanged in Los Angeles and Riverside counties.
- In the Central Valley region, affordability held even from a year ago only in two counties — Fresno and Sacramento — and fell in three counties — Kern, San Benito and Stanislaus. Kings, Madera, Merced, Placer, San Joaquin and Tulare counties recorded improvements.
- Housing affordability improved in all four counties in the Central Coast region, which includes Monterey, San Luis Obispo, Santa Barbara and Santa Cruz counties.
- During the first quarter of 2019, the most affordable counties in California were Lassen (63 percent), Kings (57 percent) and Siskiyou (53 percent). The minimum annual income needed to qualify for a home in these counties was $47,340 or less.
- Mono (10 percent), San Francisco (17 percent), Santa Cruz (17 percent) and San Mateo (18 percent) counties were the least affordable areas in the state. San Francisco and San Mateo counties required the highest minimum qualifying incomes in the state. An annual income of $322,480 was needed to purchase a home in San Francisco County, and an annual income of $323,010 was required in San Mateo County.
See C.A.R.'s historical housing affordability data.
See first-time buyer housing affordability data.
Leading the way…® in California real estate for more than 110 years, the CALIFORNIA ASSOCIATION OF REALTORS® (www.car.org) is one of the largest state trade organizations in the United States with more than 200,000 members dedicated to the advancement of professionalism in real estate. C.A.R. is headquartered in Los Angeles.
# # #
CALIFORNIA ASSOCIATION OF REALTORS®
Traditional Housing Affordability Index
First quarter 2019
|
STATE/REGION/COUNTY
|
1st Qtr. 2019
|
4th Qtr. 2018
|
|
1st Qtr. 2018
|
|
Median Home Price
|
Monthly Payment Including Taxes & Insurance
|
Minimum Qualifying Income
|
|
Calif. Single-family home
|
32
|
28
|
|
31
|
|
$545,820
|
$2,870
|
$114,860
|
|
Calif. Condo/Townhome
|
41
|
37
|
|
39
|
|
$450,000
|
$2,370
|
$94,690
|
|
Los Angeles Metro Area
|
33
|
30
|
|
32
|
|
$509,000
|
$2,680
|
$107,110
|
|
Inland Empire
|
42
|
40
|
|
43
|
|
$365,000
|
$1,920
|
$76,810
|
|
San Francisco Bay Area
|
26
|
22
|
|
23
|
|
$885,000
|
$4,660
|
$186,230
|
|
United States
|
57
|
54
|
|
57
|
|
$254,800
|
$1,340
|
$53,620
|
|
|
|
|
|
|
|
|
|
|
|
San Francisco Bay Area
|
|
|
|
|
|
|
|
|
|
Alameda
|
25
|
20
|
|
22
|
|
$865,000
|
$4,550
|
$182,020
|
|
Contra Costa
|
37
|
33
|
|
36
|
|
$630,000
|
$3,310
|
$132,570
|
|
Marin
|
21
|
19
|
|
18
|
|
$1,250,000
|
$6,580
|
$263,040
|
|
Napa
|
29
|
25
|
|
28
|
|
$672,500
|
$3,540
|
$141,510
|
|
San Francisco
|
17
|
15
|
|
15
|
|
$1,532,500
|
$8,060
|
$322,480
|
|
San Mateo
|
18
|
15
|
|
15
|
|
$1,535,000
|
$8,080
|
$323,010
|
|
Santa Clara
|
20
|
18
|
|
17
|
|
$1,220,000
|
$6,420
|
$256,720
|
|
Solano
|
46
|
39
|
|
42
|
|
$430,500
|
$2,260
|
$90,590
|
|
Sonoma
|
27
|
23
|
|
21
|
|
$632,500
|
$3,330
|
$133,100
|
|
Southern California
|
|
|
|
|
|
|
|
|
|
Los Angeles
|
28
|
24
|
|
28
|
|
$548,630
|
$2,890
|
$115,450
|
|
Orange
|
24
|
20
|
|
21
|
|
$800,000
|
$4,210
|
$168,340
|
|
Riverside
|
39
|
37
|
|
39
|
|
$409,000
|
$2,150
|
$86,070
|
|
San Bernardino
|
50
|
48
|
|
52
|
|
$299,950
|
$1,580
|
$63,120
|
|
San Diego
|
27
|
24
|
|
26
|
|
$620,000
|
$3,260
|
$130,470
|
|
Ventura
|
29
|
29
|
|
31
|
|
$630,240
|
$3,320
|
$132,620
|
|
Central Coast
|
|
|
|
|
|
|
|
|
|
Monterey
|
25
|
21
|
|
23
|
|
$585,000
|
$3,080
|
$123,100
|
|
San Luis Obispo
|
26
|
22
|
|
25
|
|
$602,000
|
$3,170
|
$126,680
|
|
Santa Barbara
|
25
|
26
|
R
|
22
|
|
$596,000
|
$3,140
|
$125,420
|
|
Santa Cruz
|
17
|
12
|
|
15
|
|
$902,500
|
$4,750
|
$189,910
|
|
Central Valley
|
|
|
|
|
|
|
|
|
|
Fresno
|
48
|
46
|
|
48
|
R
|
$272,500
|
$1,430
|
$57,340
|
|
Kern
|
50
|
53
|
|
56
|
|
$245,000
|
$1,290
|
$51,560
|
|
Kings
|
57
|
50
|
|
52
|
|
$224,950
|
$1,180
|
$47,340
|
|
Madera
|
52
|
47
|
|
49
|
R
|
$260,000
|
$1,370
|
$54,710
|
|
Merced
|
46
|
40
|
|
43
|
|
$275,000
|
$1,450
|
$57,870
|
|
Placer
|
46
|
42
|
|
44
|
|
$480,670
|
$2,530
|
$101,150
|
|
Sacramento
|
44
|
42
|
|
44
|
|
$360,000
|
$1,890
|
$75,750
|
|
San Benito
|
31
|
28
|
|
32
|
|
$610,000
|
$3,210
|
$128,360
|
|
San Joaquin
|
43
|
38
|
|
40
|
|
$365,000
|
$1,920
|
$76,810
|
|
Stanislaus
|
47
|
45
|
|
48
|
|
$314,000
|
$1,650
|
$66,070
|
|
Tulare
|
51
|
47
|
|
50
|
|
$232,000
|
$1,220
|
$48,820
|
|
Other Calif. Counties
|
|
|
|
|
|
|
|
|
|
Amador
|
NA
|
NA
|
|
45
|
|
NA
|
NA
|
NA
|
|
Butte
|
34
|
34
|
|
41
|
|
$361,100
|
$1,900
|
$75,990
|
|
Calaveras
|
47
|
45
|
|
46
|
|
$320,000
|
$1,680
|
$67,340
|
|
El Dorado
|
40
|
42
|
|
42
|
|
$489,000
|
$2,570
|
$102,900
|
|
Humboldt
|
36
|
33
|
|
36
|
|
$312,500
|
$1,640
|
$65,760
|
|
Lake
|
44
|
40
|
|
40
|
|
$255,000
|
$1,340
|
$53,660
|
|
Lassen
|
63
|
66
|
|
68
|
|
$197,000
|
$1,040
|
$41,450
|
|
Mariposa
|
41
|
38
|
|
44
|
|
$310,000
|
$1,630
|
$65,230
|
|
Mendocino
|
28
|
23
|
|
25
|
|
$385,500
|
$2,030
|
$81,120
|
|
Mono
|
10
|
12
|
|
8
|
|
$775,000
|
$4,080
|
$163,080
|
|
Nevada
|
40
|
35
|
|
37
|
|
$402,500
|
$2,120
|
$84,700
|
|
Plumas
|
48
|
42
|
|
47
|
|
$280,000
|
$1,470
|
$58,920
|
|
Shasta
|
44
|
45
|
|
49
|
|
$284,000
|
$1,490
|
$59,760
|
|
Siskiyou
|
53
|
50
|
|
48
|
|
$199,500
|
$1,050
|
$41,980
|
|
Sutter
|
46
|
44
|
|
49
|
|
$295,000
|
$1,550
|
$62,080
|
|
Tehama
|
43
|
46
|
|
51
|
|
$257,500
|
$1,350
|
$54,190
|
|
Tuolumne
|
45
|
48
|
|
49
|
|
$304,500
|
$1,600
|
$64,080
|
|
Yolo
|
39
|
37
|
|
41
|
|
$432,500
|
$2,280
|
$91,010
|
|
Yuba
|
46
|
44
|
|
49
|
|
$289,000
|
$1,520
|
$60,810
|
R = revised
NA = not available
For release:
May 14, 2019
California housing affordability climbs in first quarter 2019, C.A.R. reports
- Thirty-two percent of California households could afford to purchase the $545,820 median-priced home in the first quarter of 2019, up from 28 percent in fourth-quarter 2018 and up from 31 percent a year ago.
- A minimum annual income of $114,860 was needed to make monthly payments of $2,870, including principal, interest and taxes on a 30-year fixed-rate mortgage at a 4.62 percent interest rate.
- Forty-one percent of home buyers were able to purchase the $450,000 median-priced condo or townhome. An annual income of $94,690 was required to make a monthly payment of $2,370.
|
click to view
|
LOS ANGELES (May 14) – More Californians could afford to purchase a home in the first quarter of 2019 as lower mortgage interest rates and cooler seasonal home prices combined with higher income levels to improve California housing affordability, the CALIFORNIA ASSOCIATION OF REALTORS® (C.A.R.) said today.
The percentage of home buyers who could afford to purchase a median-priced, existing single-family home in California in first-quarter 2019 rose to 32 percent from 28 percent in the fourth quarter of 2018 and from 31 percent in the first quarter a year ago, according to C.A.R.'s Traditional Housing Affordability Index (HAI). The index climbed above 30 percent for the first time in a year. California's housing affordability index hit a peak of 56 percent in the first quarter of 2012.
C.A.R.'s HAI measures the percentage of all households that can afford to purchase a median-priced, single-family home in California. C.A.R. also reports affordability indices for regions and select counties within the state. The index is considered the most fundamental measure of housing well-being for home buyers in the state.
A minimum annual income of $114,860 was needed to qualify for the purchase of a $545,820 statewide median-priced, existing single-family home in the first quarter of 2019. The monthly payment, including taxes and insurance on a 30-year, fixed-rate loan, would be $2,870, assuming a 20 percent down payment and an effective composite interest rate of 4.62 percent. The effective composite interest rate was 4.95 percent in fourth-quarter 2018 and 4.44 percent in first-quarter 2018.
Housing affordability for condominiums and townhomes also improved in first-quarter 2019 compared to the previous quarter, with 41 percent of California households earning the minimum income to qualify for the purchase of a $450,000 median-priced condominium/townhome, up from 37 percent in the previous quarter. An annual income of $94,690 was required to make monthly payments of $2,370. Thirty-nine percent of households could afford to buy a condominium/townhome a year ago.
Compared with California, more than half of the nation's households (57 percent) could afford to purchase a $254,800 median-priced home, which required a minimum annual income of $53,620 to make monthly payments of $1,340.
Key points from the first-quarter 2019 Housing Affordability report include:
- Housing affordability improved from first-quarter 2018 in 28 tracked counties and declined in 16 counties. Affordability in four counties remained flat.
- In the San Francisco Bay Area, affordability improved from a year ago in every county. San Francisco County was the least affordable, with just 17 percent of households able to purchase the $1,532,500 median-priced home. Forty-six percent of Solano County households could afford the $430,500 median-priced home, making it the most affordable Bay Area county.
- Affordability results in the Southern California region were mixed as only Orange and San Diego counties recorded an improvement from a year ago, while San Bernardino and Ventura counties experienced a decline. Affordability was unchanged in Los Angeles and Riverside counties.
- In the Central Valley region, affordability held even from a year ago only in two counties — Fresno and Sacramento — and fell in three counties — Kern, San Benito and Stanislaus. Kings, Madera, Merced, Placer, San Joaquin and Tulare counties recorded improvements.
- Housing affordability improved in all four counties in the Central Coast region, which includes Monterey, San Luis Obispo, Santa Barbara and Santa Cruz counties.
- During the first quarter of 2019, the most affordable counties in California were Lassen (63 percent), Kings (57 percent) and Siskiyou (53 percent). The minimum annual income needed to qualify for a home in these counties was $47,340 or less.
- Mono (10 percent), San Francisco (17 percent), Santa Cruz (17 percent) and San Mateo (18 percent) counties were the least affordable areas in the state. San Francisco and San Mateo counties required the highest minimum qualifying incomes in the state. An annual income of $322,480 was needed to purchase a home in San Francisco County, and an annual income of $323,010 was required in San Mateo County.
See C.A.R.'s historical housing affordability data.
See first-time buyer housing affordability data.
Leading the way…® in California real estate for more than 110 years, the CALIFORNIA ASSOCIATION OF REALTORS® (www.car.org) is one of the largest state trade organizations in the United States with more than 200,000 members dedicated to the advancement of professionalism in real estate. C.A.R. is headquartered in Los Angeles.
# # #
CALIFORNIA ASSOCIATION OF REALTORS®
Traditional Housing Affordability Index
First quarter 2019
|
STATE/REGION/COUNTY
|
1st Qtr. 2019
|
4th Qtr. 2018
|
|
1st Qtr. 2018
|
|
Median Home Price
|
Monthly Payment Including Taxes & Insurance
|
Minimum Qualifying Income
|
|
Calif. Single-family home
|
32
|
28
|
|
31
|
|
$545,820
|
$2,870
|
$114,860
|
|
Calif. Condo/Townhome
|
41
|
37
|
|
39
|
|
$450,000
|
$2,370
|
$94,690
|
|
Los Angeles Metro Area
|
33
|
30
|
|
32
|
|
$509,000
|
$2,680
|
$107,110
|
|
Inland Empire
|
42
|
40
|
|
43
|
|
$365,000
|
$1,920
|
$76,810
|
|
San Francisco Bay Area
|
26
|
22
|
|
23
|
|
$885,000
|
$4,660
|
$186,230
|
|
United States
|
57
|
54
|
|
57
|
|
$254,800
|
$1,340
|
$53,620
|
|
|
|
|
|
|
|
|
|
|
|
San Francisco Bay Area
|
|
|
|
|
|
|
|
|
|
Alameda
|
25
|
20
|
|
22
|
|
$865,000
|
$4,550
|
$182,020
|
|
Contra Costa
|
37
|
33
|
|
36
|
|
$630,000
|
$3,310
|
$132,570
|
|
Marin
|
21
|
19
|
|
18
|
|
$1,250,000
|
$6,580
|
$263,040
|
|
Napa
|
29
|
25
|
|
28
|
|
$672,500
|
$3,540
|
$141,510
|
|
San Francisco
|
17
|
15
|
|
15
|
|
$1,532,500
|
$8,060
|
$322,480
|
|
San Mateo
|
18
|
15
|
|
15
|
|
$1,535,000
|
$8,080
|
$323,010
|
|
Santa Clara
|
20
|
18
|
|
17
|
|
$1,220,000
|
$6,420
|
$256,720
|
|
Solano
|
46
|
39
|
|
42
|
|
$430,500
|
$2,260
|
$90,590
|
|
Sonoma
|
27
|
23
|
|
21
|
|
$632,500
|
$3,330
|
$133,100
|
|
Southern California
|
|
|
|
|
|
|
|
|
|
Los Angeles
|
28
|
24
|
|
28
|
|
$548,630
|
$2,890
|
$115,450
|
|
Orange
|
24
|
20
|
|
21
|
|
$800,000
|
$4,210
|
$168,340
|
|
Riverside
|
39
|
37
|
|
39
|
|
$409,000
|
$2,150
|
$86,070
|
|
San Bernardino
|
50
|
48
|
|
52
|
|
$299,950
|
$1,580
|
$63,120
|
|
San Diego
|
27
|
24
|
|
26
|
|
$620,000
|
$3,260
|
$130,470
|
|
Ventura
|
29
|
29
|
|
31
|
|
$630,240
|
$3,320
|
$132,620
|
|
Central Coast
|
|
|
|
|
|
|
|
|
|
Monterey
|
25
|
21
|
|
23
|
|
$585,000
|
$3,080
|
$123,100
|
|
San Luis Obispo
|
26
|
22
|
|
25
|
|
$602,000
|
$3,170
|
$126,680
|
|
Santa Barbara
|
25
|
26
|
R
|
22
|
|
$596,000
|
$3,140
|
$125,420
|
|
Santa Cruz
|
17
|
12
|
|
15
|
|
$902,500
|
$4,750
|
$189,910
|
|
Central Valley
|
|
|
|
|
|
|
|
|
|
Fresno
|
48
|
46
|
|
48
|
R
|
$272,500
|
$1,430
|
$57,340
|
|
Kern
|
50
|
53
|
|
56
|
|
$245,000
|
$1,290
|
$51,560
|
|
Kings
|
57
|
50
|
|
52
|
|
$224,950
|
$1,180
|
$47,340
|
|
Madera
|
52
|
47
|
|
49
|
R
|
$260,000
|
$1,370
|
$54,710
|
|
Merced
|
46
|
40
|
|
43
|
|
$275,000
|
$1,450
|
$57,870
|
|
Placer
|
46
|
42
|
|
44
|
|
$480,670
|
$2,530
|
$101,150
|
|
Sacramento
|
44
|
42
|
|
44
|
|
$360,000
|
$1,890
|
$75,750
|
|
San Benito
|
31
|
28
|
|
32
|
|
$610,000
|
$3,210
|
$128,360
|
|
San Joaquin
|
43
|
38
|
|
40
|
|
$365,000
|
$1,920
|
$76,810
|
|
Stanislaus
|
47
|
45
|
|
48
|
|
$314,000
|
$1,650
|
$66,070
|
|
Tulare
|
51
|
47
|
|
50
|
|
$232,000
|
$1,220
|
$48,820
|
|
Other Calif. Counties
|
|
|
|
|
|
|
|
|
|
Amador
|
NA
|
NA
|
|
45
|
|
NA
|
NA
|
NA
|
|
Butte
|
34
|
34
|
|
41
|
|
$361,100
|
$1,900
|
$75,990
|
|
Calaveras
|
47
|
45
|
|
46
|
|
$320,000
|
$1,680
|
$67,340
|
|
El Dorado
|
40
|
42
|
|
42
|
|
$489,000
|
$2,570
|
$102,900
|
|
Humboldt
|
36
|
33
|
|
36
|
|
$312,500
|
$1,640
|
$65,760
|
|
Lake
|
44
|
40
|
|
40
|
|
$255,000
|
$1,340
|
$53,660
|
|
Lassen
|
63
|
66
|
|
68
|
|
$197,000
|
$1,040
|
$41,450
|
|
Mariposa
|
41
|
38
|
|
44
|
|
$310,000
|
$1,630
|
$65,230
|
|
Mendocino
|
28
|
23
|
|
25
|
|
$385,500
|
$2,030
|
$81,120
|
|
Mono
|
10
|
12
|
|
8
|
|
$775,000
|
$4,080
|
$163,080
|
|
Nevada
|
40
|
35
|
|
37
|
|
$402,500
|
$2,120
|
$84,700
|
|
Plumas
|
48
|
42
|
|
47
|
|
$280,000
|
$1,470
|
$58,920
|
|
Shasta
|
44
|
45
|
|
49
|
|
$284,000
|
$1,490
|
$59,760
|
|
Siskiyou
|
53
|
50
|
|
48
|
|
$199,500
|
$1,050
|
$41,980
|
|
Sutter
|
46
|
44
|
|
49
|
|
$295,000
|
$1,550
|
$62,080
|
|
Tehama
|
43
|
46
|
|
51
|
|
$257,500
|
$1,350
|
$54,190
|
|
Tuolumne
|
45
|
48
|
|
49
|
|
$304,500
|
$1,600
|
$64,080
|
|
Yolo
|
39
|
37
|
|
41
|
|
$432,500
|
$2,280
|
$91,010
|
|
Yuba
|
46
|
44
|
|
49
|
|
$289,000
|
$1,520
|
$60,810
|
R = revised
NA = not available

 RSS Feed