

Subscribe and receive email notifications of new blog posts.
 RSS Feed
What type of home loan are you looking for?
HOW IT WORKS
Compare top rates
See low rates from over 100+ lenders.
Select a lender
Get custom quotes in under 2 minutes.
See your savings
You could take hundreds off your mortgage.
For the week of May 24th, top offers on Bankrate are 0.62% lower than the national average. On a $340,000 30-year loan, this translates to $1,686 in annual savings.
May 17, 2024
Spring homebuying season kicks off with encouraging start;
California median home price sets new all-time high, C.A.R. reports
LOS ANGELES (May 17) – California's housing market rebounded in April as sales rose on both a monthly and yearly basis, while the statewide median home price exceeded $900,000 for the first time ever, setting a new record-high, theCALIFORNIA ASSOCIATION OF REALTORS® (C.A.R.) said today.
Infographic: https://www.car.org/Global/Infographics/2024-04-Sales-and-Price
Closed escrow sales of existing, single-family detached homes in California totaled a seasonally adjusted annualized rate of 275,540 in April, according to information collected by C.A.R. from more than 90 local REALTOR® associations and MLSs statewide. The statewide annualized sales figure represents what would be the total number of homes sold during 2024 if sales maintained the April pace throughout the year. It is adjusted to account for seasonal factors that typically influence home sales.
April's sales pace rose 3.0 percent from the revised 267,470 homes sold in March and increased 4.4 percent from a year ago, when a revised 263,960 homes were sold on an annualized basis. The sales pace remained below the 300,000-threshold for the 19th consecutive month. Year-to-date home sales grew 1.6 percent.
"April's rebound in both home sales and price shows the resilience of California's housing market and is a signal that buyers and sellers are beginning to adjust to the higher interest rate environment," said C.A.R. President Melanie Barker, a Yosemite REALTOR®. "Market fundamentals are showing signs of improvement, and competition is on the rise again; homes are selling faster and nearly half the share of homes is selling above asking price ― the highest in nine months."
The statewide median price recorded a new all-time high in April, jumping 11.4 percent from $811,510 in April 2023 to $904,210 in April 2024, exceeding the $900,000-benchmark for the first time in history. California's median home price was 5.8 percent higher than March's $854,490. The year-over-year gain was the 10th straight month of annual price increases for the Golden State. Seasonal factors and tight housing supply conditions will continue to put upward pressure on home prices in the coming months.
Sales of homes priced at or above $1 million dollars in California continue to hold up better than their more affordable counterparts in the state in the last few months. Sales in the $1 million-and-higher market segment surged 39.8 year-over-year in April, while the sub-$500,000 segment declined again moderately (-8.0 percent). The change in the mix of sales of homes priced above $1 million made up more than a third (36.4 percent) of all sales ― the largest share in at least the last five years. The growth in sales of higher-priced homes continued to provide upward support to the statewide median price and was partly responsible for the solid increase in year-over-year growth rate at the start of the second quarter.
"While the market performed solidly in April, we don't expect to see a rapid recovery as long as inflation remains sticky and mortgage rates continue to fluctuate despite recent dips," said C.A.R. Senior Vice President and Chief Economist Jordan Levine. "However, housing inventory has also started to increase, which will provide much-needed supply to the market and facilitate a higher level of home sales in the second half of the year."
Other key points from C.A.R.'s April 2024 resale housing report include:
Note: The County MLS median price and sales data in the tables are generated from a survey of more than 90 associations of REALTORS® throughout the state and represent statistics of existing single-family detached homes only. County sales data is not adjusted to account for seasonal factors that can influence home sales. Movements in sales prices should not be interpreted as changes in the cost of a standard home. The median price is where half sold for more and half sold for less; medians are more typical than average prices, which are skewed by a relatively small share of transactions at either the lower end or the upper end. Median prices can be influenced by changes in cost, as well as changes in the characteristics and the size of homes sold. The change in median prices should not be construed as actual price changes in specific homes.
*Sales-to-list-price ratio is an indicator that reflects the negotiation power of home buyers and home sellers under current market conditions. The ratio is calculated by dividing the final sales price of a property by its original list price and is expressed as a percentage. A sales-to-list ratio with 100 percent or above suggests that the property sold for more than the list price, and a ratio below 100 percent indicates that the price sold below the asking price.
**Price per square foot is a measure commonly used by real estate agents and brokers to determine how much a square foot of space a buyer will pay for a property. It is calculated as the sale price of the home divided by the number of finished square feet. C.A.R. currently tracks price-per-square foot statistics for 51 counties.
Leading the way…® in California real estate for more than 118 years, the CALIFORNIA ASSOCIATION OF REALTORS®(www.car.org) is one of the largest state trade organizations in the United States with more than 180,000 members dedicated to the advancement of professionalism in real estate. C.A.R. is headquartered in Los Angeles.
# # #
April 2024 County Sales and Price Activity
(Regional and condo sales data not seasonally adjusted)
|
April 2024 |
Median Sold Price of Existing Single-Family Homes |
Sales |
|||||||
|
State/Region/County |
April 2024 |
March 2024 |
|
April 2023 |
|
Price MTM% Chg |
Price YTY% Chg |
Sales MTM% Chg |
Sales YTY% Chg |
|
Calif. Single-family home |
$904,210 |
$854,490 |
|
$811,510 |
r |
5.8% |
11.4% |
3.0% |
4.4% |
|
Calif. Condo/Townhome |
$688,000 |
$675,000 |
|
$634,000 |
|
1.9% |
8.5% |
11.3% |
15.6% |
|
Los Angeles Metro Area |
$840,000 |
$801,000 |
|
$740,000 |
|
4.9% |
13.5% |
9.5% |
9.0% |
|
Central Coast |
$1,077,500 |
$950,000 |
|
$1,020,000 |
|
13.4% |
5.6% |
4.0% |
26.7% |
|
Central Valley |
$493,500 |
$478,600 |
|
$463,000 |
|
3.1% |
6.6% |
8.8% |
11.3% |
|
Far North |
$364,900 |
$374,950 |
|
$385,000 |
|
-2.7% |
-5.2% |
6.5% |
9.4% |
|
Inland Empire |
$607,000 |
$594,250 |
|
$565,000 |
|
2.1% |
7.4% |
1.2% |
1.5% |
|
San Francisco Bay Area |
$1,444,000 |
$1,386,500 |
|
$1,250,000 |
|
4.1% |
15.5% |
25.5% |
23.1% |
|
Southern California |
$880,000 |
$850,000 |
|
$785,000 |
|
3.5% |
12.1% |
8.8% |
8.7% |
|
|
|
|
|
|
|
|
|
|
|
|
San Francisco Bay Area |
|
|
|
|
|
|
|
|
|
|
Alameda |
$1,401,250 |
$1,400,000 |
|
$1,225,000 |
|
0.1% |
14.4% |
19.2% |
20.3% |
|
Contra Costa |
$940,000 |
$890,000 |
|
$900,000 |
|
5.6% |
4.4% |
41.2% |
19.4% |
|
Marin |
$1,700,000 |
$1,957,500 |
|
$1,790,000 |
|
-13.2% |
-5.0% |
49.0% |
2.1% |
|
Napa |
$950,000 |
$880,000 |
|
$815,000 |
|
8.0% |
16.6% |
42.4% |
37.7% |
|
San Francisco |
$1,800,000 |
$1,745,000 |
|
$1,587,500 |
|
3.2% |
13.4% |
31.7% |
27.9% |
|
San Mateo |
$2,150,000 |
$2,170,000 |
|
$1,970,000 |
|
-0.9% |
9.1% |
28.1% |
51.8% |
|
Santa Clara |
$2,000,000 |
$1,910,000 |
|
$1,800,000 |
|
4.7% |
11.1% |
24.8% |
40.8% |
|
Solano |
$590,000 |
$584,950 |
|
$580,000 |
|
0.9% |
1.7% |
3.3% |
-6.0% |
|
Sonoma |
$850,000 |
$865,000 |
|
$840,000 |
|
-1.7% |
1.2% |
14.3% |
17.5% |
|
Southern California |
|
|
|
|
|
|
|
|
|
|
Imperial |
$377,500 |
$349,000 |
|
$338,000 |
|
8.2% |
11.7% |
-26.8% |
-19.6% |
|
Los Angeles |
$825,970 |
$805,100 |
|
$738,520 |
|
2.6% |
11.8% |
11.7% |
9.0% |
|
Orange |
$1,440,000 |
$1,400,000 |
|
$1,225,000 |
|
2.9% |
17.6% |
16.6% |
24.7% |
|
Riverside |
$650,000 |
$640,000 |
|
$615,000 |
|
1.6% |
5.7% |
2.1% |
-0.4% |
|
San Bernardino |
$516,080 |
$499,900 |
|
$450,000 |
|
3.2% |
14.7% |
-0.5% |
5.3% |
|
San Diego |
$1,047,500 |
$1,020,000 |
|
$930,000 |
|
2.7% |
12.6% |
7.5% |
8.8% |
|
Ventura |
$940,000 |
$918,040 |
|
$885,500 |
|
2.4% |
6.2% |
29.6% |
10.7% |
|
Central Coast |
|
|
|
|
|
|
|
|
|
|
Monterey |
$986,500 |
$932,500 |
|
$952,500 |
|
5.8% |
3.6% |
-8.2% |
8.1% |
|
San Luis Obispo |
$894,500 |
$850,000 |
|
$925,000 |
|
5.2% |
-3.3% |
3.3% |
30.1% |
|
Santa Barbara |
$1,400,000 |
$1,015,000 |
|
$1,080,500 |
|
37.9% |
29.6% |
-2.4% |
20.1% |
|
Santa Cruz |
$1,420,000 |
$1,300,000 |
|
$1,349,500 |
|
9.2% |
5.2% |
37.5% |
63.5% |
|
Central Valley |
|
|
|
|
|
|
|
|
|
|
Fresno |
$421,940 |
$413,000 |
|
$413,000 |
|
2.2% |
2.2% |
-3.5% |
-2.1% |
|
Glenn |
$362,000 |
$340,000 |
|
$349,000 |
|
6.5% |
3.7% |
-9.1% |
-9.1% |
|
Kern |
$377,000 |
$382,180 |
|
$375,000 |
|
-1.4% |
0.5% |
10.4% |
14.5% |
|
Kings |
$379,000 |
$345,000 |
|
$361,000 |
|
9.9% |
5.0% |
9.0% |
-5.2% |
|
Madera |
$457,500 |
$435,000 |
|
$420,000 |
|
5.2% |
8.9% |
7.0% |
23.2% |
|
Merced |
$399,000 |
$392,000 |
|
$365,120 |
|
1.8% |
9.3% |
5.9% |
25.0% |
|
Placer |
$671,740 |
$659,000 |
|
$650,000 |
|
1.9% |
3.3% |
21.8% |
26.8% |
|
Sacramento |
$548,580 |
$550,000 |
|
$515,000 |
|
-0.3% |
6.5% |
11.7% |
9.0% |
|
San Benito |
$807,500 |
$768,000 |
|
$768,000 |
|
5.1% |
5.1% |
-3.0% |
18.5% |
|
San Joaquin |
$540,000 |
$550,000 |
|
$520,000 |
|
-1.8% |
3.8% |
13.3% |
21.5% |
|
Stanislaus |
$485,000 |
$460,000 |
|
$451,000 |
|
5.4% |
7.5% |
12.3% |
6.2% |
|
Tulare |
$379,990 |
$374,990 |
|
$357,000 |
|
1.3% |
6.4% |
-5.2% |
4.8% |
|
Far North |
|
|
|
|
|
|
|
|
|
|
Butte |
$450,000 |
$434,000 |
|
$469,000 |
|
3.7% |
-4.1% |
6.9% |
10.7% |
|
Lassen |
$205,000 |
$247,000 |
|
$252,950 |
|
-17.0% |
-19.0% |
60.0% |
-20.0% |
|
Plumas |
$320,000 |
$407,500 |
|
$319,250 |
|
-21.5% |
0.2% |
25.0% |
25.0% |
|
Shasta |
$360,000 |
$364,000 |
|
$390,000 |
|
-1.1% |
-7.7% |
0.0% |
17.9% |
|
Siskiyou |
$281,500 |
$350,000 |
|
$289,000 |
|
-19.6% |
-2.6% |
64.7% |
-9.7% |
|
Tehama |
$309,750 |
$286,250 |
|
$315,000 |
|
8.2% |
-1.7% |
0.0% |
-4.8% |
|
Trinity |
$212,000 |
$360,000 |
|
$307,500 |
|
-41.1% |
-31.1% |
-50.0% |
-16.7% |
|
Other Calif. Counties |
|
|
|
|
|
|
|
|
|
|
Amador |
$426,500 |
$482,500 |
|
$475,000 |
|
-11.6% |
-10.2% |
41.2% |
45.5% |
|
Calaveras |
$493,000 |
$454,500 |
|
$495,000 |
|
8.5% |
-0.4% |
25.0% |
46.3% |
|
Del Norte |
$445,000 |
$381,250 |
|
$315,000 |
|
16.7% |
41.3% |
-33.3% |
-7.7% |
|
El Dorado |
$757,000 |
$677,000 |
|
$717,220 |
|
11.8% |
5.5% |
27.7% |
27.0% |
|
Humboldt |
$400,000 |
$429,970 |
|
$439,000 |
|
-7.0% |
-8.9% |
23.5% |
18.3% |
|
Lake |
$340,000 |
$315,000 |
|
$317,000 |
r |
7.9% |
7.3% |
0.0% |
15.7% |
|
Mariposa |
$549,500 |
$415,000 |
|
$425,000 |
|
32.4% |
29.3% |
-12.0% |
340.0% |
|
Mendocino |
$583,500 |
$375,000 |
|
$485,000 |
|
55.6% |
20.3% |
7.0% |
84.0% |
|
Mono |
$1,077,380 |
$1,250,000 |
|
$1,177,750 |
|
-13.8% |
-8.5% |
-72.7% |
-25.0% |
|
Nevada |
$599,000 |
$525,000 |
|
$550,000 |
|
14.1% |
8.9% |
13.7% |
23.9% |
|
Sutter |
$428,500 |
$403,200 |
|
$405,000 |
|
6.3% |
5.8% |
-8.1% |
-26.1% |
|
Tuolumne |
$452,000 |
$400,000 |
|
$419,050 |
|
13.0% |
7.9% |
22.2% |
-5.2% |
|
Yolo |
$615,000 |
$635,830 |
|
$605,000 |
|
-3.3% |
1.7% |
0.0% |
11.2% |
|
Yuba |
$427,950 |
$452,570 |
|
$447,450 |
|
-5.4% |
-4.4% |
58.6% |
39.4% |
r = revised
NA = not available
April 2024 County Unsold Inventory and Days on Market
(Regional and condo sales data not seasonally adjusted)
|
April 2024 |
Unsold Inventory Index |
Median Time on Market |
||||||||
|
State/Region/County |
April 2024 |
March 2024 |
|
April 2023 |
|
April 2024 |
March 2024 |
|
April 2023 |
|
|
Calif Single-family home |
2.6 |
2.6 |
|
2.5 |
|
16.0 |
19.0 |
|
20.0 |
|
|
Calif. Condo/Townhome |
2.5 |
2.6 |
|
2.2 |
|
19.0 |
18.0 |
|
19.0 |
|
|
Los Angeles Metro Area |
2.7 |
2.7 |
|
2.6 |
|
21.0 |
23.0 |
|
25.0 |
|
|
Central Coast |
3.0 |
2.9 |
|
3.1 |
|
13.0 |
16.0 |
|
17.0 |
|
|
Central Valley |
2.6 |
2.6 |
|
2.4 |
|
16.0 |
19.0 |
|
19.0 |
|
|
Far North |
4.7 |
4.3 |
|
4.3 |
r |
26.0 |
33.5 |
|
30.0 |
|
|
Inland Empire |
3.3 |
3.1 |
|
2.8 |
|
28.0 |
32.0 |
|
32.0 |
|
|
San Francisco Bay Area |
1.9 |
2.0 |
|
1.9 |
|
12.0 |
13.0 |
|
14.0 |
|
|
Southern California |
2.6 |
2.6 |
|
2.5 |
|
19.0 |
20.0 |
|
22.0 |
|
|
|
|
|
|
|
|
|
|
|
|
|
|
San Francisco Bay Area |
|
|
|
|
|
|
|
|
|
|
|
Alameda |
1.4 |
1.3 |
|
1.3 |
|
10.0 |
11.0 |
|
11.0 |
|
|
Contra Costa |
1.5 |
1.7 |
|
1.4 |
|
10.0 |
10.0 |
|
10.0 |
|
|
Marin |
2.8 |
3.2 |
|
2.1 |
|
41.0 |
42.0 |
|
37.0 |
|
|
Napa |
3.9 |
5.0 |
|
4.4 |
|
49.5 |
61.0 |
|
43.0 |
|
|
San Francisco |
1.8 |
2.1 |
|
2.4 |
|
26.5 |
29.0 |
|
31.0 |
|
|
San Mateo |
1.8 |
2.2 |
|
2.6 |
|
8.0 |
9.0 |
|
11.0 |
|
|
Santa Clara |
1.5 |
1.6 |
|
1.9 |
|
7.0 |
8.0 |
|
8.0 |
|
|
Solano |
2.7 |
2.5 |
|
1.9 |
|
39.0 |
37.0 |
|
34.0 |
|
|
Sonoma |
3.1 |
2.8 |
|
2.7 |
|
45.0 |
51.5 |
|
52.0 |
|
|
Southern California |
|
|
|
|
|
|
|
|
|
|
|
Imperial |
2.8 |
1.7 |
|
NA |
|
13.0 |
13.0 |
|
21.0 |
|
|
Los Angeles |
2.6 |
2.6 |
|
2.6 |
|
17.5 |
20.0 |
|
22.0 |
|
|
Orange |
2.1 |
2.2 |
|
2.3 |
|
18.0 |
18.0 |
|
19.0 |
|
|
Riverside |
3.1 |
3.0 |
|
2.7 |
|
28.0 |
31.0 |
|
32.0 |
|
|
San Bernardino |
3.7 |
3.4 |
|
3.2 |
|
27.0 |
36.0 |
|
30.0 |
|
|
San Diego |
2.2 |
2.2 |
|
1.9 |
|
12.0 |
12.0 |
|
12.0 |
|
|
Ventura |
2.5 |
2.9 |
|
2.2 |
|
27.0 |
28.5 |
|
28.0 |
|
|
Central Coast |
|
|
|
|
|
|
|
|
|
|
|
Monterey |
3.6 |
2.8 |
|
3.0 |
|
10.0 |
14.0 |
|
18.0 |
|
|
San Luis Obispo |
2.9 |
2.8 |
|
3.2 |
|
18.5 |
22.0 |
|
22.0 |
|
|
Santa Barbara |
3.0 |
2.7 |
|
2.5 |
|
10.0 |
13.0 |
|
15.0 |
|
|
Santa Cruz |
2.7 |
3.3 |
|
3.9 |
|
11.0 |
15.5 |
|
15.0 |
|
|
Central Valley |
|
|
|
|
|
|
|
|
|
|
|
Fresno |
3.2 |
2.8 |
|
2.6 |
|
18.0 |
19.0 |
|
19.0 |
|
|
Glenn |
4.1 |
3.4 |
|
3.5 |
|
15.0 |
12.0 |
|
32.0 |
|
|
Kern |
2.4 |
2.6 |
|
2.4 |
|
19.0 |
19.0 |
|
15.0 |
|
|
Kings |
2.5 |
2.7 |
|
2.1 |
|
19.0 |
11.0 |
|
14.0 |
|
|
Madera |
3.8 |
4.0 |
|
4.2 |
|
31.0 |
33.0 |
|
35.0 |
|
|
Merced |
2.6 |
2.2 |
|
2.7 |
|
20.0 |
16.0 |
|
15.5 |
|
|
Placer |
2.5 |
2.7 |
|
2.6 |
|
20.0 |
24.0 |
|
24.0 |
|
|
Sacramento |
2.1 |
2.2 |
|
1.8 |
|
13.0 |
15.0 |
r |
18.0 |
|
|
San Benito |
4.1 |
3.6 |
|
3.7 |
|
24.0 |
34.0 |
|
26.0 |
|
|
San Joaquin |
2.3 |
2.4 |
|
2.5 |
|
16.0 |
18.0 |
|
25.0 |
|
|
Stanislaus |
2.6 |
2.6 |
|
2.1 |
|
13.0 |
14.0 |
|
14.0 |
|
|
Tulare |
3.0 |
2.6 |
|
2.6 |
|
20.0 |
20.0 |
|
22.0 |
|
|
Far North |
|
|
|
|
|
|
|
|
|
|
|
Butte |
3.3 |
3.2 |
|
3.3 |
|
19.0 |
17.0 |
|
25.0 |
|
|
Lassen |
7.0 |
9.3 |
|
4.8 |
|
58.5 |
95.0 |
|
43.0 |
|
|
Plumas |
6.6 |
5.5 |
|
6.6 |
|
60.0 |
132.0 |
|
55.0 |
|
|
Shasta |
4.0 |
3.3 |
|
4.3 |
|
21.0 |
30.0 |
|
22.0 |
|
|
Siskiyou |
8.3 |
10.9 |
|
5.5 |
|
63.0 |
57.0 |
|
52.0 |
|
|
Tehama |
6.6 |
5.6 |
|
6.0 |
|
97.5 |
50.5 |
|
58.0 |
|
|
Trinity |
18.4 |
8.9 |
|
NA |
|
165.0 |
121.0 |
|
49.0 |
|
|
Other Calif. Counties |
|
|
|
|
|
|
|
|
|
|
|
Amador |
5.1 |
6.6 |
|
5.3 |
|
37.0 |
35.0 |
|
38.0 |
|
|
Calaveras |
4.9 |
5.2 |
|
4.9 |
|
48.5 |
34.5 |
|
80.0 |
|
|
Del Norte |
7.8 |
4.7 |
|
6.5 |
|
17.5 |
77.0 |
|
16.0 |
|
|
El Dorado |
3.4 |
3.8 |
|
3.0 |
|
24.5 |
27.0 |
|
30.5 |
|
|
Humboldt |
5.8 |
6.8 |
|
5.0 |
|
22.5 |
16.5 |
|
17.0 |
|
|
Lake |
6.2 |
5.9 |
|
7.0 |
r |
62.0 |
55.0 |
|
54.0 |
r |
|
Mariposa |
3.9 |
3.4 |
|
15.4 |
|
28.0 |
17.0 |
|
171.0 |
|
|
Mendocino |
6.7 |
6.5 |
|
11.4 |
|
60.0 |
94.0 |
|
60.0 |
|
|
Mono |
8.0 |
1.6 |
|
5.8 |
|
7.0 |
46.0 |
|
20.0 |
|
|
Nevada |
4.6 |
4.0 |
|
4.4 |
|
19.0 |
55.0 |
|
29.0 |
|
|
Sutter |
4.1 |
3.5 |
|
2.7 |
|
36.5 |
18.0 |
|
22.5 |
|
|
Tuolumne |
4.9 |
4.9 |
|
3.2 |
|
17.0 |
84.0 |
|
33.5 |
|
|
Yolo |
2.5 |
2.8 |
|
2.4 |
|
16.0 |
18.5 |
|
11.5 |
|
|
Yuba |
2.8 |
4.0 |
|
3.1 |
|
27.0 |
39.0 |
|
29.5 |
|
r = revised
NA = not available
Article belongs to CAR.ORG
Both Realtors, investors, home buyers and renters across California continue to wait in limbo for the 2024 California housing market to unfold. Is this spring the "inflection point" the media have touted for markets?
 California Realtor Sentiment in December. Screenshot courtesy of CAR.org.
Is this the year, frustrated buyers will finally have the opportunity to buy, or will rising home prices leave them all behind? While mortgage rates and payments declined in December, home and condo prices climbed slightly. And as the charts below reveal, active listings are weakening. Despite growing optimism in consumers, the properties simply aren't there nor affordable.
Surveys show consumer sentiment is rising and Realtor's outlook is positive as well. Most of it might be ignoring the lagging effects of the rapid FED rate hikes, and focusing solely on cheaper mortgages coming. But sellers will still face steep challenges in selling their homes.
And stats show that homeowners aren't listing their homes. And new reports have it that baby boomers aren't willing to let go of their homes. There doesn't seem to be a solution for the housing crisis, and as the US and California economy return perhaps later this year, it's easy to see home prices in California picking up pace.
California Association of Realtors' latest report reveals single-family home sales across the state stayed flat for December 2023, while being down 7.1% from Dec 2022.
The statewide median price for houses fell .3% from November, yet is still up 4.3% from 12 months ago.

Home prices follow normal seasonal pattern. Screenshot courtesy of CAR.org.
Are new record prices predicted for 2024? Despite the seasonal trend, as you can see in the CAR chart below, home prices fell last year with a decided reversal in 2023.

Home Price Growth Chart California. Screenshot courtesy of CAR.
Sales fell again in December. However, year over year we saw a shocking decline of 24.8% in sales. 2023 was a year many would like to forget. And now the question is, will 2024 bring improvement? As you'll see below in the charts, the trend is toward fewer listings and higher prices. That's not necessarily good news for buyers or rental property investors, as sellers feel they can get a better price later.

Homes sales as bad as the Great Recession. Screenshot courtesy of CAR.org.
While the state has suffered a major loss of businesses and residents, there is a continuous supply of new residents arriving and businesses being formed. The attraction of the Golden State never seems to falter.
The FED continues to struggle with its battle with inflation while sending signals both ways regarding expected rate cuts this year. There's lots to consider in weighing the California real estate market outlook besides mortgage rates. Consumer spending, which has supported the economy may have to continue doing so, until more housing can be built and small business gets full traction again.
Sales of existing resale homes rose very slightly at a seasonal rate of 224,000.
The good news is that mortgage rates have stayed below last October's levels and will likely fall further as the year progresses. Without knowing how the FED will react to a slowing economy, it's difficult for buyers and sellers to know what to do.
 Mortgage rates and payments decline. Screenshot courtesy of CAR.org
Current 2024 C.A.R. President Melanie Barker said, "The housing market had a tough year in 2023 as a shortage of homes for sale and high costs of borrowing continues its negative impact on housing inventory and demand. With mortgage rates expected to come down in the next 12 months, home sales will bounce back as buyers and sellers return to a more favorable housing market. Home prices should see a moderate increase in 2024 as well."
Sales in all major California housing regions dipped in December with the Central Valley and San Francisco regions seeing the largest declines (14.8% year over year) and (-11.8% year over year) respectively. 37 of 52 counties saw a reduction in sales year over year.
Home prices on the other hand rose in all regions with the Central Coast and the San Francisco Bay Area rising 12.6% in median price.
Unsold inventory fell 16.7% month over month across the state and supply was reduced from 3 to 2.5 days.
Active Listings declined year over and from November.

Active Resale Home Listings Drop. Screenshot courtesy of CAR.org.
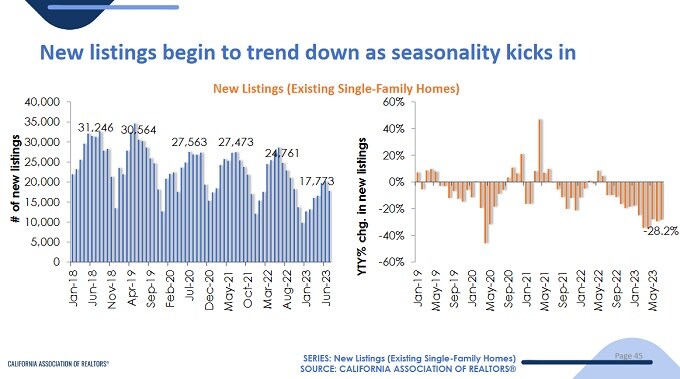
New Home Listings Still Negative. Screenshot courtesy of CAR.org.
Housing supply continued its relentless slide as more than half 52 counties reported drops.

California Housing Supply Falls. Screenshot courtesy of CAR.org.
The biggest home prices changes month to month occurred in Santa Barbara with a 32.2% rise to $1,190,000, San Bernardino up 6.5% to a new median price of $506,000.
The largest drop in prices came in San Francisco, down 5.5% to $1,450,000, San Diego down 4.3% to $911,500, Contra Costa down 7% to $800,000 and Alameda down 4.5% to $1,175,000. Napa saw a price growth in December of 12% or $100,000 to $925,000.
Napa County after a 15.4% in price during October, saw a big downshift of 19.7% last month, which was up from 15.6% monthly price drop in September. Santa Barbara prices too fell again last month by 34.3%, after a 33% rise in October, and a 20.5% drop in September.
The Bay Area suffered huge drops in sales (-14.6%) and that was down 22.4% from 12 months ago. San Mateo home prices dropped .3% to $1,800,000, while in Monterey prices dropped fell 1.6% to $929,000. San Francisco home prices fell 5.5% whiles sales slumped 39%. Santa Clara too suffered a 17.3% drop.
San Bernardino bucked the trend with a 16.9% growth in sales.
In Southern California which has the biggest impact on the California average prices fell 4.2%. Orange County had sales drop 8.1% while prices jumped 14.9%. Los Angeles County saw prices drop 5% while sales declined 3%.
As the stats reveal, condo prices fell $25,000 on average in December while sales slid 3.7%. Year over year, condo prices are still up 8.2%.

Condo Prices and Sales Year over Year. Screenshot courtesy of CAR.org.
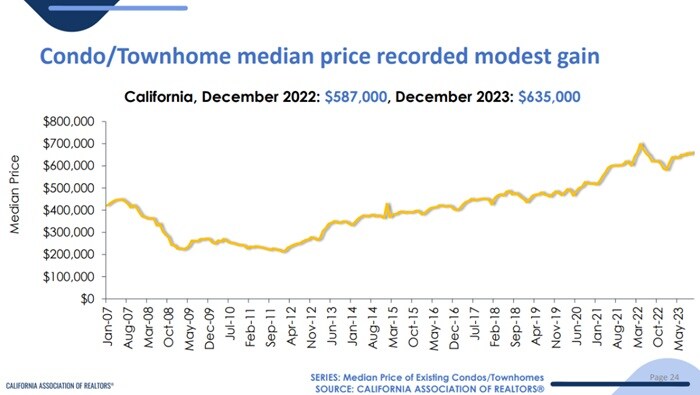
Condo Price California. Screenshot courtesy of CAR.org.
CAR felt optimistic in its 2024 housing market forecast with falling mortgage rates, rising prices, economic expansion, and with demand for homes strong.
Home prices are predicted to rise 6.2% to a record median price of $680,300 next year. Housing affordability will remain flat. Out of all of it, and despite an outmigration of Californians to low-tax states, the state remains viable and people want to buy homes here.
Redfin's house sales price numbers are just slightly below those of CAR.

Home price growth in California. Screenshot courtesy of Redfin.
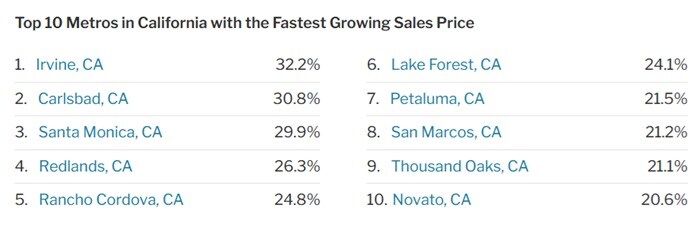
California Metros with strongest Price growth in December. Screenshot courtesy of Redfin.com

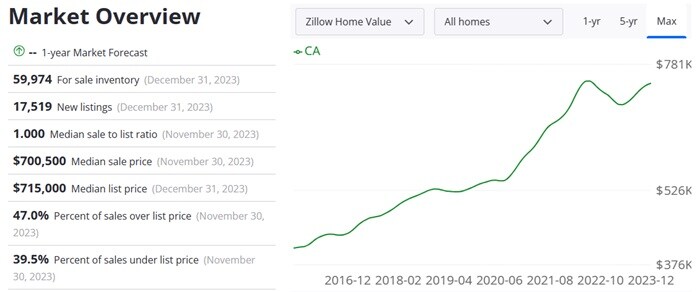
Home Prices California, last 10 years. Screenshot courtesy of Zillow.com
* Many thanks to CAR, and Zillow for the market info and graphics.
Rental Property Management Excellence. Share on Your Website or Social Channels!
Although the buyer market is deteriorating, there are plenty of buyers with funds who can jump into the market for homes or rentals when mortgage rates ease. Although rent prices are falling in California, and likely will further in 2024, there is always a possibility of higher California rent prices. as the economy rises from a short downturn. However, economists are divided on the economic outlook. With energy prices low and reshoring of manufacturing to the U.S, it's hard to get gloomy about 2024 and beyond.
When mortgage rates fall further, it could set off a wave of homes on the market. This could present financial issues for landlords as renters leave rentals to occupy their own homes.
Rent prices are down $45 per month according to Zillow's rental report for December 2023, and this down $230 from one year ago. There are 74,558 units for rent in its system.
The biggest factors for the housing market forecast:
Unexpectedly for most Realtors, homeowners and home sellers, the debt ceiling crisis may result in upward pressure on interest rates. If rates persist, it could deflate many of the optimistic projections for sales. And prices would likely still rise given the severe housing shortages.
C.A.R. Vice President and Chief Economist Jordan Levine predicted that "High inflationary pressures will keep mortgage rates elevated, which will reduce homebuyers' purchasing power and depress housing affordability in the upcoming year. With borrowing costs remaining high in the next 12 months, a pull-back in sales and a downward adjustment in home prices are expected in 2023."
Levine added, "Home prices will also moderate further over the next several months as interest rates remain elevated in the near term and seasonal factors come into play."
The baseline scenario of C.A.R.'s "2024 California Housing Market Forecast" sees an increase in existing single-family home sales of 22.9 percent next year to reach 327,100 units, up from the projected 2023 sales figure of 266,200. The 2023 figure is 22.2 percent lower compared with the pace of 342,000 homes sold in 2022."
The revised California median home price forecast is for a rise 0f 6.2% to $860,300 in 2024, a -1.5% drop this year to $810,000 from $822,300 in 2022. A persistent housing shortage and a competitive housing market will continue to put upward pressure on home prices next year.

California housing market forecast CAR Chart by Year. Screenshot courtesy of CAR.
The rental market however appears to be a different story from the home resales market. Rental property investors have a completely different opportunity to recover their costs (with well selected properties).
California has the highest percentage of people looking to buy elsewhere. California, New York, District of Columbia, Massachusetts, and Illinois were the top 5 states homebuyers searched to move from. The top 5 states homebuyers searched to move to were Florida, Texas, Arizona, Maryland, and South Carolina.
The combination of housing market downturn risk, rising interest rates, and inflation may anke Californian homeowners consider selling their property this fall. Yet, letting go of low, locked in rates is perhaps the key reason why many will not sell. That selling intention is lessened by desires to get a comfortable price, having to make extreme relocation choices, and entering into a new, more expensive mortgage.
As layoffs in the corporate sector grow against fast-rising mortgage rates, August and September's housing market decline may worsen the October and December outlook.
11 California cities ranked as most expensive for renters out of top 70 in the US according to a new report from Zumper. See recent California rent price stats provided by Zumper.com.
| 1 Bedroom | 2 Bedrooms | ||||||
| Rank | City | Price | M/M% | Y/Y% | Price | M/M% | Y/Y% |
| 2 | San Francisco, CA | $3,000 | 3.4% | 7.5% | $3,950 | -1.3% | 7.0% |
| 3 | San Jose, CA | $2,570 | 3.6% | 19.0% | $3,130 | 2.0% | 15.9% |
| 6 | Los Angeles, CA | $2,360 | 0.0% | 18.0% | $3,200 | 0.6% | 16.4% |
| 7 | San Diego, CA | $2,320 | -6.1% | 20.8% | $2,910 | -6.1% | 14.6% |
| 9 | Santa Ana, CA | $2,110 | 3.4% | 24.1% | $2,770 | -3.5% | 23.7% |
| 10 | Oakland, CA | $2,100 | 2.4% | 5.0% | $2,800 | 1.1% | 10.7% |
| 14 | Anaheim, CA | $1,860 | -2.6% | 12.0% | $2,470 | -6.1% | 22.3% |
| 18 | Long Beach, CA | $1,710 | -1.7% | 6.2% | $2,280 | -5.0% | 7.5% |
| 24 | Sacramento, CA | $1,600 | 0.0% | 8.8% | $1,980 | 1.0% | 7.6% |
| 31 | Fresno, CA | $1,520 | 6.3% | 25.6% | $1,680 | 5.0% | 15.1% |
| 69 | Bakersfield, CA | $1,060 | -1.9% | 9.3% | $1,380 | 0.7% | 15.0% |
Please note that CAR designates the Los Angeles Metropolitan Area as a 5- region that includes Los Angeles, Orange, Riverside , San Bernardino , and Ventura. The Bay Area includes: Alameda, Contra Costa, Marin, Napa, San Francisco, San Mateo, Santa Clara, Solano, and Sonoma. And the Inland Empire includes Riverside and San Bernardino counties.
According to C.A.R.'s monthly Consumer Housing Sentiment Index, in April 2023, 59% of consumers said it was a good time to sell, up from 55% the previous. Only about 25% feel it is a good time to buy a home, unchanged from last year. With rent prices falling, is hanging on for a few more years wise? Will you be searching for a new rental home? See national rent prices city by city and cost of living city by city.
A lot of buyers are asking whether home prices will rise or fall? Renters are wondering if rent prices will fall? High demand, low mortgage rates, and low inventory will likely skew homes and condo prices higher. The trend is here and the return of buyers is here. A number of factors are contributing to California's positive sales stats:
"Low rates and tight housing inventory are contributing factors to the statewide median price setting a new record high three months in a row from June to August. A change in the mix of sales is another variable that keeps pushing median prices higher, as sales growth of higher-priced properties continued to outpace their more affordable counterparts," said C.A.R. Senior Vice President and Chief Economist Leslie Appleton-Young.
The latest survey of Realtors shows fewer are withdrawing offer, more are listing new properties, and are not optimistic about sales or prices.
C.A.R. Predicted More Home Sales and Higher Prices for 2021: Leslie Appleton-Young delivered her updated California housing market forecast for 2021. She expected sales to continue to improve through 2021.
The prediction is based on growing buyer demand that's pushed California's median price above $700,000 and low inventories that will cause price increases. As know now, sales have declined.
California's weekly showings index rose to 182.3% higher than it was in September of 2019. Mortgage rates have dropped back down and purchase applications rose 24.2% on an annual basis last week.
Share the news and market insight on your blog!
This updated report covers important stats including home prices, sales, and recent home sales trends from CAR, NAR, DOT, St Louis Fed, NAHB, Statista, Zillow and more. For national home price trends see the US real estate housing market.
The key story with Los Angeles, San Francisco, San Jose, Santa Clara, San Diego, Orange County, Riverside, San Bernardino, etc. is the lack of listings.
Managing rental properties in California? See more on ManageCasa's platform for modern property managers.
Article belongs to Housing Market
These Golden State avocados are grown in the rich soil of California, warmed by its sunshine and cooled by gentle coastal breezes. California Avocados are locally and responsibly grown by California farmers who nurture the avocados and the land every step of the way to ensure that you can buy high quality avocados during the California Avocado season. They are committed to building and maintaining a sustainable California Avocado industry by using environmentally friendly farming practices, ensuring worker well-being, contributing to healthy communities and maintaining economic viability.