

Posts with tag 'california'

Sunshine Properties Blog

Subscribe and receive email notifications of new blog posts.


rss logo RSS Feed
Uncategorized | 860 Posts
May
1

Click Here to Read More...

April
25

Moving and Growing Your Business at the Same Time

Are you looking to move and start a business all at the same time? Well, if so, then you've come to the right place. Sunshine Properties Real Estate is here to talk about what it takes for success in this endeavor. Here are some points that will help you make your move and grow your business more smoothly.

Qualities to Look for in a New House

When choosing a home for your business and residence, there are certain qualities to look for, such as a safe neighborhood, good schools or universities nearby, access to public transportation, a low crime rate, and plenty of parking. Additionally, depending on the type of business you are planning on starting, consider how much space is available both indoors and outdoors. If you plan on starting an online store or working remotely from home,

Click Here to Read More...

April
25

ERIK'S DELICAFÉ SHOWCASES EARLY SPRING CALIFORNIA AVOCADOS

  • Apr 21, 2023

Loyal chain partner Erik's DeliCafé transitioned to California avocados in early spring to promote the use of local produce to their customers; a move they have been committed to for the past three years. Throughout the promotions, which will run from March 27 through May 14, the foodservice chain will feature fresh California avocados in a variety of menu items and showcase the California Avocados brand logo on its digital channels.

Erik's DeliCafé will run their six-week promotion across 27 units throughout the Northern California San Francisco Bay Area. To celebrate the early California avocado season, the chain will feature fresh California avocados on their Pilgrim's Progress, Turkey with Pesto, Rio Grande Club, Natural High, Del Monte Spe...

Click Here to Read More...

April
25

Uptick in mortgage interest rates nudges down California home sales
in March, C.A.R. reports

  • Existing, single-family home sales totaled 281,050 in March on a seasonally adjusted annualized rate, down 1.0 percent from February and down 34.2 percent from March 2022.

  • March's statewide median home price was $791,490, up 7.6 percent from February and down 7.0 percent from March 2022.

  • Year-to-date statewide home sales were down 37.8 percent in March.

LOS ANGELES (April 18) – Moderately higher interest rates held California home sales essentially flat in March, while the statewide median home price recorded a healthy increase on a month-to-month basis for the first time in seven months, the CALIFORNIA ASSOCIATION OF REALTORS® (C.A.R.) said today. 

Infographic:  https://www.car.org/Global/Infographics/2023-03-Sales-and-Price

Closed escrow sales of existing, single-family detached homes in California totaled a seasonally adjusted annualized rate of 281,050 in March, according to information collected by C.A.R. from more than 90 local REALTOR® associations and MLSs statewide. The statewide annualized sales figure represents what would be the total number of homes sold during 2023 if sales maintained the March pace throughout the year. It is adjusted to account for seasonal factors that typically influence home sales.

March's sales pace was down 1.0 percent on a monthly basis from 284,010 in February and down 34.2 percent from a year ago, when a revised 427,040 homes were sold on an annualized basis. Sales of existing single-family homes in California remained below the 300,000-unit pace for the sixth consecutive month.

"Despite a dip in March home sales, the competitiveness in the housing market continues to heat up, as homes are selling faster, and the sales-to-list-price ratio is improving, all the while when the number of homes available for sale continues to tighten," said C.A.R. President Jennifer Branchini, a Bay Area REALTOR®. "All signs point to a market with solid demand, which should help bolster sales through the homebuying season."

California's median home price grew for the first time in seven months in March, increasing 7.6 percent from February's $735,480 to $791,490. March's price also was lower on a year-over-year basis for the fifth consecutive month, declining 7.0 percent from the revised $851,130 recorded last March. With home prices rising more sharply than the normal seasonal pattern last year, the market could see larger year-over-year price drops as it moves through the spring home-buying season.

"While home sales continue to hover below the 300,000-unit annualized pace, the market seems to have weathered more aggressive rate hikes and banking failures quite well in the last few weeks," said C.A.R. Vice President and Chief Economist Jordan Levine. "If interest rates stabilize or even improve in the next couple of months, home sales should rise during the spring home-buying season, but tight inventory will prevent a rapid rebound."

Other key points from C.A.R.'s March 2023 resale housing report include:

  • At the regional level, all regions except the Central Valley (-27.7 percent) continued to record annual sales declines of more than 30 percent, with the Far North dropping the most at -38.9 percent. Sales in four of the six counties in the region dipped more than 40 percent from a year ago. The San Francisco Bay Area followed closely behind with a sales decrease of 35.5 percent from a year ago, while Southern California (-33.8 percent) and Central Coast (-31.2 percent) both declined sharply from last March.

  • All but one of the 51 counties tracked by C.A.R. experienced a sales drop from a year ago in March, with 35 counties dropping more than 30 percent year-over-year and five counties plummeting more than 50 percent from last March. Extreme weather conditions throughout the state in the past few weeks had a negative impact on the housing market, which contributed to sharp sales declines in some of these counties. Plumas (-77.3 percent) had the largest sales drop in March, followed by Mono (-70.6 percent) and Glenn (-52.9 percent). Amador was the only county with an annual sales increase, with a year-over-year gain of 6.4 percent. The market is gaining momentum, however, as it enters the spring homebuying season. All but one county tracked by C.A.R. posted a sales gain on a month-over-month basis, while sales in 23 counties grew more than 50 percent from February.

  • At the regional level, median home prices dropped from a year ago in all major regions, with prices in three of the five regions declining more than 10 percent year-over-year in March. Home prices in the San Francisco Bay Area continued to drop the most of all regions, even though it was no longer the only region with a double-digit decline. With prices in five counties falling over 10 percent year-over-year, the median price for the Bay Area region was down 12.8 percent from March 2022. The sharp decline is attributable partly to the base effect, as prices surged a year ago when many homebuyers tried to close transactions before rates climbed further. Central Coast (-12.1 percent) and the Far North (-10.1 percent) were the other two regions with a double-digit loss from a year ago, followed by Central Valley (-8.4 percent) and Southern California (-4.0 percent).

  • More than four out of five counties experienced year-over-year price declines in March, with 18 counties falling more than 10 percent on a year-over-year basis. Santa Barbara (-40.8 percent) had the biggest drop of all counties, followed by Mono (-31.8 percent), and Tehama (-29.5 percent). Six counties registered an increase in their median prices from last March, with all but one county growing less than 10 percent. Glenn had the biggest gain in price of all counties with an increase of 15.6 percent, followed by Kings (9.2 percent) and Humboldt (4.7 percent).

  • Following its typical seasonal pattern, housing inventory in California dipped on a monthly basis for the second straight month from 3.2 months in February to 2.2 months in March, the lowest level since May 2022. The statewide unsold inventory index (UII) in March 2023, nevertheless, continued to increase from a year ago, jumping 37.5 percent on a year-over-year basis. The surge in UII was due primarily to low housing demand as existing home sales remained below the annualized 300,000 benchmark level.

  • All price ranges posted an increase in UII from a year ago by 28 percent or more, with the $1 million and up gaining the most (50 percent), followed by the $500,000 - $749,000 price range (25.0 percent), the $750,000 - $999,000 (23.5 percent) and the sub $500,000 (16.7 percent).

  • With sales remaining 30 percent or more below last year's level for more than half of the counties in California, active listings continued to surge year-over-year in March. Twenty-one counties recorded a double-digit, year-over-year gain in March as compared to 43 counties in February. Marin registered the largest yearly growth of 52.5 percent, followed by Kings (50.7 percent) and Riverside (46.3 percent). Meanwhile, 20 counties recorded a decline in active listings from a year ago as sales growth outpaced the gain in new active listings in some of these counties. Mono (52.9 percent) had the biggest year-over-year decline in March, followed by Alameda (-45.3 percent) and Contra Costa (-43.2 percent).


  • Despite the increase in overall active listings in March, housing inventory is much tighter than what the yearly growth suggests. While new active listings added in March improved 27.9 percent on a month-to-month basis from the prior month, the figure also declined 30 percent year-over-year from the same month in 2022. The drop in new active listings, in fact, was the largest dip since May 2020 when the pandemic shutdown took place.


  • The median number of days it took to sell a California single-family home was 19 days in March and 8 days in March 2022.
  • C.A.R.'s statewide sales-price-to-list-price ratio* was 99.1 percent in March 2023 and 103.9 percent in March 2022.
  • The statewide average price per square foot** for an existing single-family home was $388, down from $418 in March a year ago.
  • The 30-year, fixed-mortgage interest rate averaged 6.54 percent in March, up from 4.17 percent in March 2022, according to Freddie Mac.

Note:  The County MLS median price and sales data in the tables are generated from a survey of more than 90 associations of REALTORS® throughout the state and represent statistics of existing single-family detached homes only. County sales data is not adjusted to account for seasonal factors that can influence home sales. Movements in sales prices should not be interpreted as changes in the cost of a standard home. The median price is where half sold for more and half sold for less; medians are more typical than average prices, which are skewed by a relatively small share of transactions at either the lower end or the upper end. Median prices can be influenced by changes in cost, as well as changes in the characteristics and the size of homes sold. The change in median prices should not be construed as actual price changes in specific homes.

*Sales-to-list-price ratio is an indicator that reflects the negotiation power of home buyers and home sellers under current market conditions. The ratio is calculated by dividing the final sales price of a property by its original list price and is expressed as a percentage. A sales-to-list ratio with 100 percent or above suggests that the property sold for more than the list price, and a ratio below 100 percent indicates that the price sold below the asking price.

**Price per square foot is a measure commonly used by real estate agents and brokers to determine how much a square foot of space a buyer will pay for a property. It is calculated as the sale price of the home divided by the number of finished square feet. C.A.R. currently tracks price-per-square foot statistics for 50 counties.

Leading the way…® in California real estate for more than 110 years, the CALIFORNIA ASSOCIATION OF REALTORS® (www.car.org) is one of the largest state trade organizations in the United States with more than 200,000 members dedicated to the advancement of professionalism in real estate. C.A.R. is headquartered in Los Angeles.


March 2023 County Sales and Price Activity
(Regional and condo sales data not seasonally adjusted)

March 2023

Median Sold Price of Existing Single-Family Homes

Sales

State/Region/County

March

2023

Feb.

2023


March

2022


Price MTM% Chg

Price YTY% Chg

Sales MTM% Chg

Sales YTY% Chg

Calif. Single-family home

$791,490

$735,480

r

$851,130

r

7.6%

-7.0%

-1.0%

-34.2%

Calif. Condo/Townhome

$640,000

$615,000


$660,000

r

4.1%

-3.0%

39.4%

-36.8%

Los Angeles Metro Area

$735,000

$710,000


$770,000


3.5%

-4.5%

39.1%

-34.2%

Central Coast

$922,500

$856,000


$1,050,000


7.8%

-12.1%

44.0%

-31.2%

Central Valley

$453,550

$449,000


$495,000


1.0%

-8.4%

37.5%

-27.7%

Far North

$355,000

$369,000


$395,000


-3.8%

-10.1%

35.7%

-38.9%

Inland Empire

$555,000

$549,900


$580,000


0.9%

-4.3%

31.0%

-39.6%

San Francisco Bay Area

$1,228,000

$1,050,000


$1,408,000

r

17.0%

-12.8%

59.9%

-35.5%

Southern California

$770,000

$745,000


$802,500


3.4%

-4.0%

38.3%

-33.8%


San Francisco Bay Area


Alameda

$1,225,000

$1,100,000


$1,430,000


11.4%

-14.3%

52.2%

-36.8%

Contra Costa

$852,500

$760,000


$965,900


12.2%

-11.7%

58.6%

-42.7%

Marin

$1,600,000

$1,447,500


$1,720,000

r

10.5%

-7.0%

31.6%

-39.4%

Napa

$890,000

$830,000


$965,000

r

7.2%

-7.8%

89.5%

-32.7%

San Francisco

$1,700,000

$1,465,000


$2,060,000


16.0%

-17.5%

57.3%

-37.9%

San Mateo

$1,860,000

$2,080,000


$2,280,000


-10.6%

-18.4%

43.5%

-37.7%

Santa Clara

$1,700,000

$1,500,000


$1,950,000


13.3%

-12.8%

97.1%

-31.9%

Solano

$585,000

$555,000


$610,000

r

5.4%

-4.1%

51.3%

-21.3%

Sonoma

$829,000

$774,500


$829,000

r

7.0%

0.0%

43.8%

-31.8%

Southern California


Los Angeles

$718,370

$726,870


$781,050


-1.2%

-8.0%

43.2%

-30.2%

Orange

$1,250,000

$1,159,000


$1,305,000


7.9%

-4.2%

43.8%

-30.0%

Riverside

$612,000

$595,000


$620,000


2.9%

-1.3%

35.8%

-37.6%

San Bernardino

$475,000

$466,500


$475,000


1.8%

0.0%

22.1%

-43.4%

San Diego

$915,000

$875,000


$950,000


4.6%

-3.7%

34.9%

-32.1%

Ventura

$849,000

$805,000


$914,000


5.5%

-7.1%

55.3%

-36.3%

Central Coast


Monterey

$900,000

$775,500


$911,000


16.1%

-1.2%

53.0%

-27.8%

San Luis Obispo

$895,000

$795,000


$903,000


12.6%

-0.9%

43.2%

-23.6%

Santa Barbara

$769,000

$860,000


$1,300,000


-10.6%

-40.8%

25.2%

-41.0%

Santa Cruz

$1,205,000

$1,201,000


$1,600,000


0.3%

-24.7%

64.9%

-31.9%

Central Valley


Fresno

$409,500

$385,000


$415,000


6.4%

-1.3%

31.1%

-24.7%

Glenn

$370,000

$295,000


$320,000


25.4%

15.6%

14.3%

-52.9%

Kern

$365,000

$375,000


$369,750


-2.7%

-1.3%

36.2%

-28.6%

Kings

$355,000

$352,000


$325,000


0.9%

9.2%

51.0%

-8.3%

Madera

$417,000

$378,000


$430,000


10.3%

-3.0%

21.1%

-40.4%

Merced

$400,000

$381,950


$385,000


4.7%

3.9%

65.9%

-38.1%

Placer

$641,000

$633,750


$701,730


1.1%

-8.7%

28.2%

-22.7%

Sacramento

$500,000

$499,000


$560,000


0.2%

-10.7%

33.2%

-31.9%

San Benito

$750,000

$730,000


$835,000


2.7%

-10.2%

10.7%

-31.1%

San Joaquin

$544,550

$491,500


$550,000


10.8%

-1.0%

65.9%

-17.5%

Stanislaus

$449,000

$429,900


$470,500


4.4%

-4.6%

37.0%

-34.3%

Tulare

$344,000

$340,000


$360,980


1.2%

-4.7%

48.2%

-22.6%

Far North


Butte

$421,650

$405,000


$465,000


4.1%

-9.3%

4.0%

-42.2%

Lassen

$249,000

$212,500


$243,000


17.2%

2.5%

150.0%

-51.6%

Plumas

$310,000

$305,000


$391,500


1.6%

-20.8%

-37.5%

-77.3%

Shasta

$365,000

$350,000


$390,000


4.3%

-6.4%

48.8%

-36.4%

Siskiyou

$240,000

$208,000


$308,000


15.4%

-22.1%

58.8%

-42.6%

Tehama

$283,180

$332,000


$401,880


-14.7%

-29.5%

45.5%

-5.9%

Other Calif. Counties


Amador

$414,940

$429,500


$440,000


-3.4%

-5.7%

66.7%

6.4%

Calaveras

$438,000

$437,500


$492,000


0.1%

-11.0%

50.0%

-52.6%

Del Norte

$400,000

$300,000


$398,000


33.3%

0.5%

87.5%

-50.0%

El Dorado

$625,000

$619,000


$750,000


1.0%

-16.7%

28.6%

-46.7%

Humboldt

$450,000

$417,250


$430,000


7.8%

4.7%

66.0%

-26.5%

Lake

$351,250

$305,000


$370,000


15.2%

-5.1%

73.7%

-28.3%

Mariposa

$399,500

$353,000


$530,000


13.2%

-24.6%

220.0%

-30.4%

Mendocino

$492,500

$495,500


$509,000

r

-0.6%

-3.2%

22.2%

-37.7%

Mono

$750,000

$802,500


$1,100,000


-6.5%

-31.8%

150.0%

-70.6%

Nevada

$539,500

$475,000


$559,000


13.6%

-3.5%

22.4%

-41.8%

Sutter

$385,000

$415,000


$460,000


-7.2%

-16.3%

18.6%

-35.4%

Tuolumne

$389,500

$361,000


$450,000


7.9%

-13.4%

132.3%

-25.0%

Yolo

$618,030

$550,000


$657,000


12.4%

-5.9%

57.1%

-18.9%

Yuba

$425,000

$435,950


$432,500


-2.5%

-1.7%

117.5%

-16.3%

r = revised


March 2023 County Unsold Inventory and Days on Market
(Regional and condo sales data not seasonally adjusted)

March 2023

Unsold Inventory Index

Median Time on Market

State/Region/County

March

2023

Feb.

2023


March

2022


March

2023

Feb.

2023


March

2022


Calif. Single-family home

2.2

3.2


1.6

r

19.0

28.0


8.0


Calif. Condo/Townhome

2.0

2.9


1.4


17.0

23.0


7.0


Los Angeles Metro Area

2.3

3.4


1.7


22.0

34.0


9.0


Central Coast

2.3

3.5


1.8


14.0

21.0


8.0


Central Valley

2.0

2.9


1.6


19.0

27.0


7.0


Far North

3.6

5.0


2.6


29.0

45.0


14.0


Inland Empire

2.7

3.7


1.6


31.0

45.0


10.0


San Francisco Bay Area

1.6

2.7


1.4


14.0

17.0


8.0


Southern California

2.2

3.2


1.6


19.0

30.5


8.0


San Francisco Bay Area


Alameda

1.1

2.0


1.4


13.0

12.0


8.0


Contra Costa

1.2

2.5


1.2


13.0

18.0


7.0


Marin

2.3

2.4


1.1

r

16.5

30.5


9.0


Napa

3.3

5.8


2.2

r

32.0

29.0


25.0

r

San Francisco

2.4

3.4


1.6


15.0

18.0


12.0


San Mateo

1.8

2.4


1.4


11.0

12.0


7.0


Santa Clara

1.4

2.9


1.4


9.0

9.0


7.0


Solano

1.7

2.7


1.0

r

35.0

57.0


15.0

r

Sonoma

2.2

3.2


1.6

r

30.0

55.5


23.0


Southern California


Los Angeles

2.2

3.4


1.8


19.0

30.0


8.0


Orange

2.0

2.9


1.6


13.0

23.0


6.0


Riverside

2.6

3.6


1.5


32.0

45.5


11.0


San Bernardino

3.0

3.8


1.8


29.0

43.0


10.0


San Diego

1.7

2.3


1.4


12.0

17.0


7.0


Ventura

2.0

3.3


1.6


28.0

34.5


17.0


Central Coast


Monterey

2.4

3.9


1.7


16.0

23.0


9.0


San Luis Obispo

2.6

3.7


2.1


14.0

16.0


6.0


Santa Barbara

1.8

3.0


1.5


14.0

20.0


8.0


Santa Cruz

2.3

3.5


1.8


13.0

23.0


9.0


Central Valley


Fresno

2.4

3.3


1.8


18.0

24.0


7.0


Glenn

5.3

6.0


2.4


27.0

46.0


13.0


Kern

2.0

2.8


1.6


21.0

31.0


7.0


Kings

2.3

3.7


1.6


18.0

39.0


6.5


Madera

4.3

5.0


2.2


21.0

32.0


10.0


Merced

2.7

5.0


1.9


16.0

25.0


9.5


Placer

2.0

2.5


1.6


23.0

41.0


6.0


Sacramento

1.5

2.1


1.4


15.0

22.0


7.0


San Benito

3.0

3.5


2.3


25.0

38.5


12.0


San Joaquin

1.9

2.7


1.6


25.0

34.0


7.0


Stanislaus

2.0

2.6


1.5


15.0

24.0


7.0


Tulare

2.1

3.4


1.8


21.5

29.0


8.0


Far North


Butte

3.1

3.4


2.1


28.5

35.0


8.0


Lassen

5.3

15.7


2.8


92.0

73.0


99.0


Plumas

15.0

10.1


5.6


167.0

85.0


57.5


Shasta

3.1

4.5


2.2


26.0

36.0


12.0


Siskiyou

5.7

9.0


3.9


29.0

68.0


14.5


Tehama

3.6

5.5


4.2


27.5

57.5


34.5


Other Calif. Counties


Amador

3.2

4.9


3.1


31.0

42.0


9.0


Calaveras

4.0

5.4


2.3


62.0

91.0


40.0


Del Norte

5.5

9.3


2.7


116.0

59.5


88.0


El Dorado

2.8

3.4


2.0


27.0

47.0


11.0


Humboldt

4.0

7.1


2.9


35.0

29.5


9.0


Lake

4.6

7.3


3.5


48.5

85.0


38.0


Mariposa

3.8

12.0


3.6


96.0

25.0


11.5


Mendocino

7.5

8.8


5.2

r

86.0

119.0


57.0

r

Mono

3.6

12.5


2.3


59.0

130.5


64.0


Nevada

3.0

3.4


2.5


31.5

56.0


9.0


Sutter

2.4

3.0


1.6


25.0

22.0


8.0


Tuolumne

2.3

4.9


2.5


94.0

83.0


16.5


Yolo

2.1

2.4


1.4


15.0

27.0


7.0


Yuba

2.5

5.0


2.0


23.0

30.0


7.0


r = revised

Article belongs to CAR.org

March
1

Current Mortgage Rates for March 1, 2023: Rates Climb

Some important mortgage rates moved up over the last seven days, though not as fast as last week. The Fed's interest rate hikes have increased costs for homebuyers.

Brick house with white columns and a fall tree with bright leaves in front
John Greim/Getty Images

Some closely followed mortgage rates moved up over the last seven days. The average 15-year fixed and 30-year fixed mortgage rates both grew, albeit at a slower rate than we saw last week. For variable rates, the 5/1 adjustable-rate mortgage also climbed.

After nearly a year of rising mortgage rates, borrowers finally saw some relief late last year. Rates have declined since they hit their peak in late 2022, though current rates remain nearly double what they were during the record-low rate environment of the pandemic.

Inflation, and the series of rate hikes the Federal Reserve implemented in 2022 in an attempt to curb it, contributed in part to the rise in mortgage rates. Mortgage rates hit a 20-year high in late 2022, but now the macroeconomic environment is changing again.

Overall inflation remains high but has been slowly but consistently falling every month since it peaked in June 2022. The Fed's decision to raise the federal funds rate by 0.25% on Feb. 1 after its latest meeting -- the smallest increase since March 2022 -- suggests that inflation may be cooling and the central bank may be able to ease up on its rate hikes.

What does this mean for homebuyers this year? Mortgage rates are likely to decrease slightly in 2023, although they're highly unlikely to return to the rock-bottom levels of 2020 and 2021. However, rate volatility may continue for some time. "Expect mortgage rates to yo-yo up and down in the first half of the year, at least until there is a consensus about when the Fed will conclude raising interest rates," says Greg McBride, CFA and chief financial analyst at Bankrate. (Like CNET Money, Bankrate is owned by Red Ventures.) McBride expects rates to fall more consistently as the year progresses. "Thirty-year fixed mortgage rates will end the year near 5.25%," he predicts.

Rather than worrying about market mortgage rates, homebuyers should focus on what they can control: getting the best rate they can for their situation. Take steps to improve your credit score and save for a down payment to increase your odds of qualifying for the lowest rate available. Also, be sure to compare the rates and fees from multiple lenders to get the best deal. Looking at the annual percentage rate, or APR, will show you the total cost of borrowing and help you compare apples to apples.

30-year fixed-rate mortgages

The average 30-year fixed mortgage interest rate is 7.03%, which is an increase of 7 basis points from one week ago. (A basis point is equivalent to 0.01%.) The most common loan term is a 30-year fixed mortgage. A 30-year fixed mortgage will usually have a greater interest rate than a 15-year fixed rate mortgage -- but also a lower monthly payment. Although you'll pay more interest over time -- you're paying off your loan over a longer timeframe -- if you're looking for a lower monthly payment, a 30-year fixed mortgage may be a good option.

15-year fixed-rate mortgages

The average rate for a 15-year, fixed mortgage is 6.31%, which is an increase of 7 basis points from seven days ago. Compared to a 30-year fixed mortgage, a 15-year fixed mortgage with the same loan value and interest rate will have a bigger monthly payment. However, as long as you can afford the monthly payments, there are several benefits to a 15-year loan. These include usually being able to get a lower interest rate, paying off your mortgage sooner, and paying less total interest in the long run.

5/1 adjustable-rate mortgages

A 5/1 ARM has an average rate of 5.80%, an addition of 17 basis points from the same time last week. For the first five years, you'll usually get a lower interest rate with a 5/1 adjustable-rate mortgage compared to a 30-year fixed mortgage. However, since the rate shifts with the market rate, you may end up paying more after that time, as described in the terms of your loan. If you plan to sell or refinance your house before the rate changes, an ARM may make sense for you. Otherwise, shifts in the market mean your interest rate may be much higher once the rate adjusts.

Mortgage rate trends

Mortgage rates were historically low throughout most of 2020 and 2021 but increased steadily throughout 2022. The Federal Reserve raised the target federal funds rate -- which influences the cost of most consumer loans, including mortgages -- seven times in 2022 in an attempt to curb record-high inflation. Though the Fed doesn't directly control mortgage rates, higher inflation and a higher federal funds rate tend to lead to higher mortgage rates.

The Fed's latest 0.25% increase -- smaller than its six previous increases of 0.75% or 0.5% -- represents a shift in the Fed's stance and suggests that the central bank might be less aggressive in its rate hikes in 2023 if inflation continues to come down. But inflation is still far from the Fed's 2% target range and Fed officials have stated repeatedly (PDF) that additional rate hikes -- albeit smaller ones -- will be necessary. All said, while we may see mortgage rates pull back gradually this year, borrowers shouldn't expect a sharp drop or a return to pandemic lows.

We use data collected by Bankrate, which is owned by the same parent company as CNET, to track changes in these daily rates. This table summarizes the average rates offered by lenders nationwide:

Average mortgage interest rates

Product Rate Last week Change
30-year fixed 7.03% 6.96% +0.07
15-year fixed 6.31% 6.24% +0.07
30-year jumbo mortgage rate 7.06% 6.99% +0.07
30-year mortgage refinance rate 7.11% 7.03% +0.08

Rates as of March 1, 2023.

How to shop for the best mortgage rate

You can get a personalized mortgage rate by connecting with your local mortgage broker or using an online calculator. When researching home mortgage rates, think about your goals and current finances.

A range of factors -- including your down payment, credit score, loan-to-value ratio and debt-to-income ratio -- will all affect your mortgage interest rate. Having a higher credit score, a higher down payment, a low DTI, a low LTV or any combination of those factors can help you get a lower interest rate.

Apart from the interest rate, factors including closing costs, fees, discount points and taxes might also affect the cost of your home. Be sure to speak with multiple lenders -- including local and national banks, credit unions and online lenders -- and comparison shop to find the best mortgage loan for you.

How does the loan term impact my mortgage?

When picking a mortgage, it's important to consider the loan term, or payment schedule. The most common mortgage terms are 15 years and 30 years, although 10-, 20- and 40-year mortgages also exist. Mortgages are further divided into fixed-rate and adjustable-rate mortgages. For fixed-rate mortgages, interest rates are fixed for the life of the loan. Unlike a fixed-rate mortgage, the interest rates for an adjustable-rate mortgage are only fixed for a certain amount of time (usually five, seven or 10 years). After that, the rate adjusts annually based on the market rate.

One factor to consider when deciding between a fixed-rate and adjustable-rate mortgage is the length of time you plan on living in your house. For people who plan on staying long-term in a new house, fixed-rate mortgages may be the better option. While adjustable-rate mortgages may offer lower interest rates upfront, fixed-rate mortgages are more stable in the long term. If you don't plan to keep your new home for more than three to 10 years, though, an adjustable-rate mortgage may give you a better deal. There is no best loan term as a rule of thumb; it all depends on your goals and your current financial situation. Be sure to do your research and understand your own priorities when choosing a mortgage.

Why You Can Trust CNET
Our expert, award-winning staff selects the products we cover and rigorously researches and tests our top picks. If you buy through our links, we may get a commission. Reviews ethics statement

Looking for Great Deals? Use CNET Shopping to Save Time and Money

Here's how to use our browser extension to get the best deals (and some bonus resources, too) when shopping on many of the web's most popular retailer sites.

It's 2023, and even with the holidays behind us, you're probably buying things online more than ever. But whether you're looking for a gift or just nabbing some household basics, how do you know if you're actually getting the best price? That's where CNET Shopping comes in. This browser extension was formerly known as PriceBlink, and it recently became a part of the CNET family. Once installed, it rides along when you're shopping at many of your favorite online retailers -- Amazon, Walmart, Best Buy and Target, to name a few -- where it'll make sure you're getting the best deal (among the stores we cover). 

It has three main features -- here's how it works.

Three ways to save

When you install the CNET Shopping extension, you'll unlock three ways to save money while you shop online. 

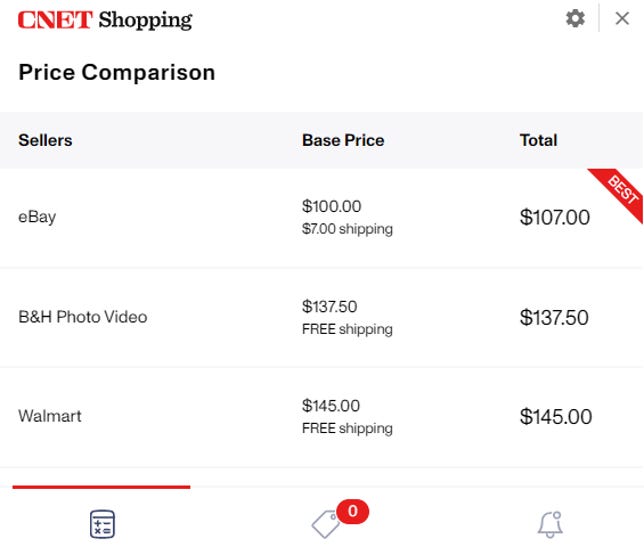
price-comparo.png
Screenshot by CNET

Price comparison: Once you've installed the extension, point you browser to a product page at any major online retailer -- Amazon, Target, Walmart and the like -- and CNET Shopping will instantly search the web for better offers. While it's not foolproof, it generally provides an excellent snapshot of competing prices among the web's top stores. You'll know right away whether you're getting the best price, or be able to jump to a more affordable competitor. 

Coupon finder: Did you know you may be losing out on free discounts when you buy online? With CNET Shopping installed, you'll immediately be made aware of the relevant coupon codes available on the site where you're shopping -- including a checkout scan to verify any possible final deals. 

Price tracking: Looking to buy something, but waiting for it to go on sale? With CNET Shopping's price tracker, you can do just that. On some products at supported retailers, you'll see an "Add Price Alert" button (as shown below) that will add that product to your personal tracking list. If and when it hits a discount percentage you specify, you'll be notified so you can pounce on the sale. 

Article belongs to CNET.com

⇦ Newer PostsOlder Posts ⇨

Login to My Homefinder

Pixel