
Sunshine Properties Blog
Subscribe and receive email notifications of new blog posts.
 RSS Feed
- 2026 | 59 Posts
- 2025 | 133 Posts
- 2024 | 168 Posts
- 2023 | 105 Posts
- 2022 | 144 Posts
- 2020 | 12 Posts
- 2019 | 44 Posts
- 2018 | 106 Posts
- 2017 | 80 Posts
14
California housing affordability climbs in first quarter 2019, C.A.R. reports
California housing affordability climbs in first quarter 2019, C.A.R. reports
|
 click to view |
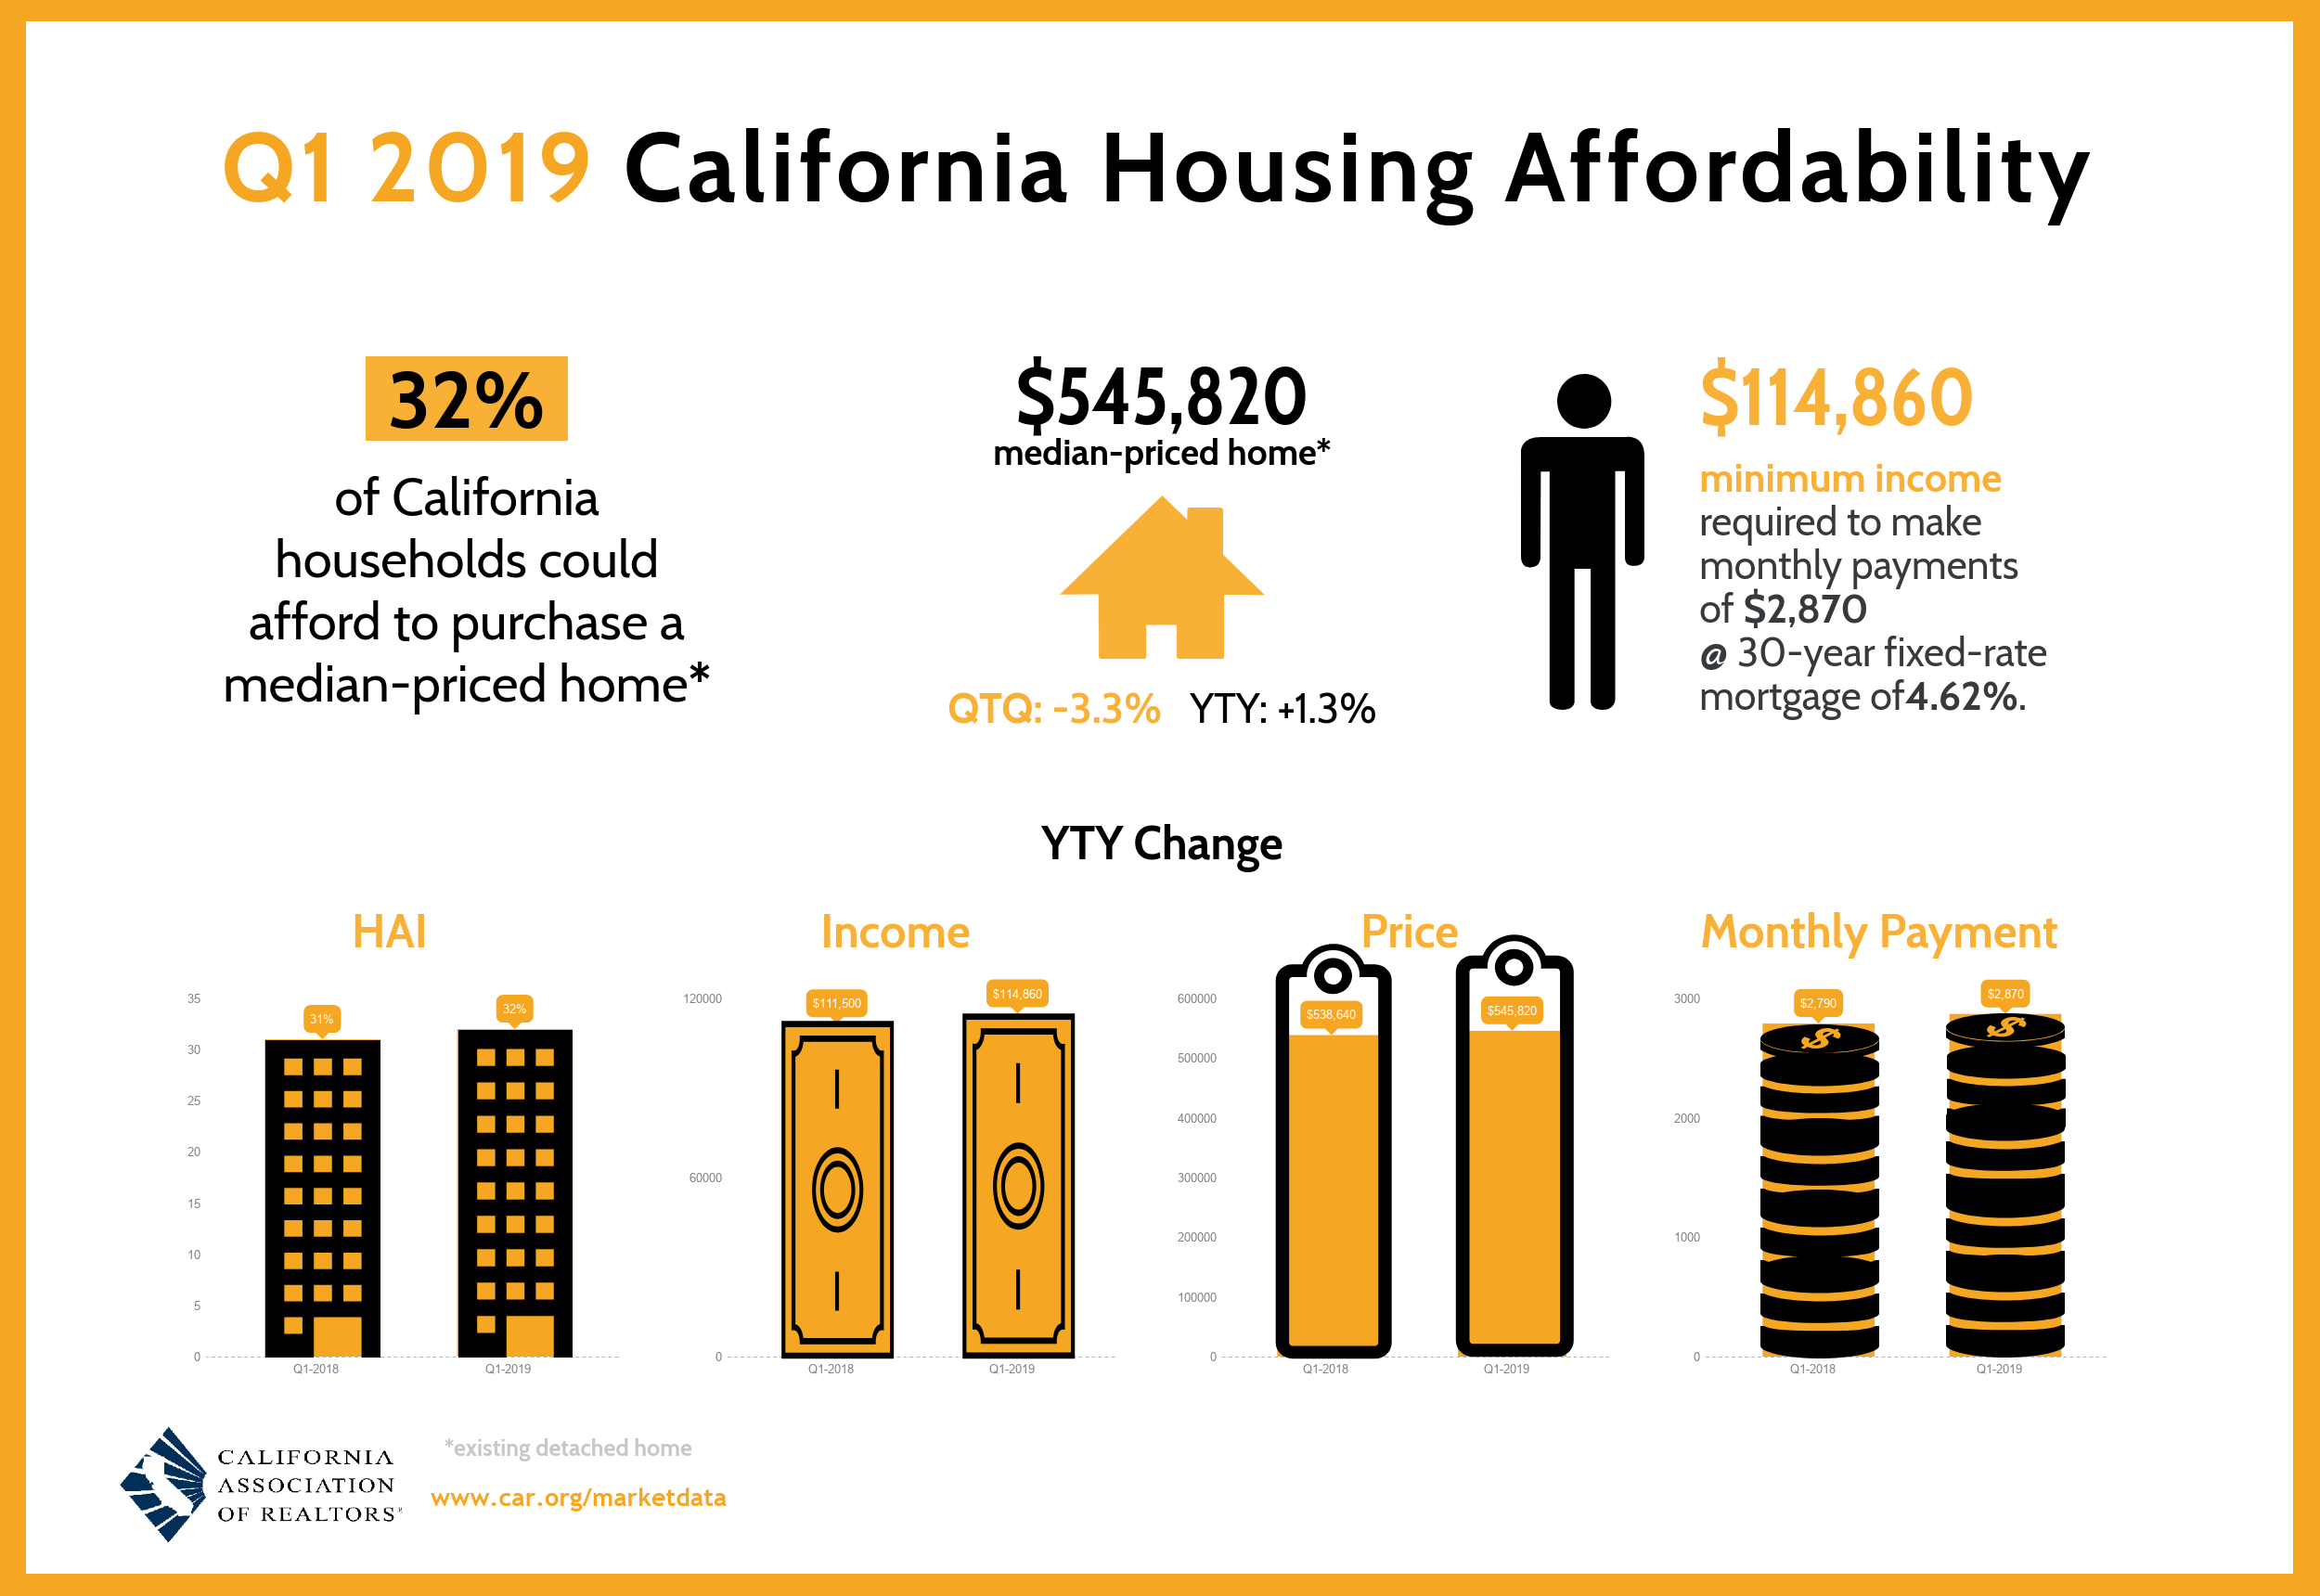
LOS ANGELES (May 14) – More Californians could afford to purchase a home in the first quarter of 2019 as lower mortgage interest rates and cooler seasonal home prices combined with higher income levels to improve California housing affordability, the CALIFORNIA ASSOCIATION OF REALTORS® (C.A.R.) said today.
The percentage of home buyers who could afford to purchase a median-priced, existing single-family home in California in first-quarter 2019 rose to 32 percent from 28 percent in the fourth quarter of 2018 and from 31 percent in the first quarter a year ago, according to C.A.R.'s Traditional Housing Affordability Index (HAI). The index climbed above 30 percent for the first time in a year. California's housing affordability index hit a peak of 56 percent in the first quarter of 2012.
C.A.R.'s HAI measures the percentage of all households that can afford to purchase a median-priced, single-family home in California. C.A.R. also reports affordability indices for regions and select counties within the state. The index is considered the most fundamental measure of housing well-being for home buyers in the state.
A minimum annual income of $114,860 was needed to qualify for the purchase of a $545,820 statewide median-priced, existing single-family home in the first quarter of 2019. The monthly payment, including taxes and insurance on a 30-year, fixed-rate loan, would be $2,870, assuming a 20 percent down payment and an effective composite interest rate of 4.62 percent. The effective composite interest rate was 4.95 percent in fourth-quarter 2018 and 4.44 percent in first-quarter 2018.
Housing affordability for condominiums and townhomes also improved in first-quarter 2019 compared to the previous quarter, with 41 percent of California households earning the minimum income to qualify for the purchase of a $450,000 median-priced condominium/townhome, up from 37 percent in the previous quarter. An annual income of $94,690 was required to make monthly payments of $2,370. Thirty-nine percent of households could afford to buy a condominium/townhome a year ago.
Compared with California, more than half of the nation's households (57 percent) could afford to purchase a $254,800 median-priced home, which required a minimum annual income of $53,620 to make monthly payments of $1,340.
Key points from the first-quarter 2019 Housing Affordability report include:
- Housing affordability improved from first-quarter 2018 in 28 tracked counties and declined in 16 counties. Affordability in four counties remained flat.
- In the San Francisco Bay Area, affordability improved from a year ago in every county. San Francisco County was the least affordable, with just 17 percent of households able to purchase the $1,532,500 median-priced home. Forty-six percent of Solano County households could afford the $430,500 median-priced home, making it the most affordable Bay Area county.
- Affordability results in the Southern California region were mixed as only Orange and San Diego counties recorded an improvement from a year ago, while San Bernardino and Ventura counties experienced a decline. Affordability was unchanged in Los Angeles and Riverside counties.
- In the Central Valley region, affordability held even from a year ago only in two counties — Fresno and Sacramento — and fell in three counties — Kern, San Benito and Stanislaus. Kings, Madera, Merced, Placer, San Joaquin and Tulare counties recorded improvements.
- Housing affordability improved in all four counties in the Central Coast region, which includes Monterey, San Luis Obispo, Santa Barbara and Santa Cruz counties.
- During the first quarter of 2019, the most affordable counties in California were Lassen (63 percent), Kings (57 percent) and Siskiyou (53 percent). The minimum annual income needed to qualify for a home in these counties was $47,340 or less.
- Mono (10 percent), San Francisco (17 percent), Santa Cruz (17 percent) and San Mateo (18 percent) counties were the least affordable areas in the state. San Francisco and San Mateo counties required the highest minimum qualifying incomes in the state. An annual income of $322,480 was needed to purchase a home in San Francisco County, and an annual income of $323,010 was required in San Mateo County.
See C.A.R.'s historical housing affordability data.
See first-time buyer housing affordability data.
Leading the way…® in California real estate for more than 110 years, the CALIFORNIA ASSOCIATION OF REALTORS® (www.car.org) is one of the largest state trade organizations in the United States with more than 200,000 members dedicated to the advancement of professionalism in real estate. C.A.R. is headquartered in Los Angeles.
# # #
CALIFORNIA ASSOCIATION OF REALTORS®
Traditional Housing Affordability Index
First quarter 2019
|
STATE/REGION/COUNTY |
1st Qtr. 2019 |
4th Qtr. 2018 |
|
1st Qtr. 2018 |
|
Median Home Price |
Monthly Payment Including Taxes & Insurance |
Minimum Qualifying Income |
|
Calif. Single-family home |
32 |
28 |
|
31 |
|
$545,820 |
$2,870 |
$114,860 |
|
Calif. Condo/Townhome |
41 |
37 |
|
39 |
|
$450,000 |
$2,370 |
$94,690 |
|
Los Angeles Metro Area |
33 |
30 |
|
32 |
|
$509,000 |
$2,680 |
$107,110 |
|
Inland Empire |
42 |
40 |
|
43 |
|
$365,000 |
$1,920 |
$76,810 |
|
San Francisco Bay Area |
26 |
22 |
|
23 |
|
$885,000 |
$4,660 |
$186,230 |
|
United States |
57 |
54 |
|
57 |
|
$254,800 |
$1,340 |
$53,620 |
|
|
|
|
|
|
|
|
|
|
|
San Francisco Bay Area |
|
|
|
|
|
|
|
|
|
Alameda |
25 |
20 |
|
22 |
|
$865,000 |
$4,550 |
$182,020 |
|
Contra Costa |
37 |
33 |
|
36 |
|
$630,000 |
$3,310 |
$132,570 |
|
Marin |
21 |
19 |
|
18 |
|
$1,250,000 |
$6,580 |
$263,040 |
|
Napa |
29 |
25 |
|
28 |
|
$672,500 |
$3,540 |
$141,510 |
|
San Francisco |
17 |
15 |
|
15 |
|
$1,532,500 |
$8,060 |
$322,480 |
|
San Mateo |
18 |
15 |
|
15 |
|
$1,535,000 |
$8,080 |
$323,010 |
|
Santa Clara |
20 |
18 |
|
17 |
|
$1,220,000 |
$6,420 |
$256,720 |
|
Solano |
46 |
39 |
|
42 |
|
$430,500 |
$2,260 |
$90,590 |
|
Sonoma |
27 |
23 |
|
21 |
|
$632,500 |
$3,330 |
$133,100 |
|
Southern California |
|
|
|
|
|
|
|
|
|
Los Angeles |
28 |
24 |
|
28 |
|
$548,630 |
$2,890 |
$115,450 |
|
Orange |
24 |
20 |
|
21 |
|
$800,000 |
$4,210 |
$168,340 |
|
Riverside |
39 |
37 |
|
39 |
|
$409,000 |
$2,150 |
$86,070 |
|
San Bernardino |
50 |
48 |
|
52 |
|
$299,950 |
$1,580 |
$63,120 |
|
San Diego |
27 |
24 |
|
26 |
|
$620,000 |
$3,260 |
$130,470 |
|
Ventura |
29 |
29 |
|
31 |
|
$630,240 |
$3,320 |
$132,620 |
|
Central Coast |
|
|
|
|
|
|
|
|
|
Monterey |
25 |
21 |
|
23 |
|
$585,000 |
$3,080 |
$123,100 |
|
San Luis Obispo |
26 |
22 |
|
25 |
|
$602,000 |
$3,170 |
$126,680 |
|
Santa Barbara |
25 |
26 |
R |
22 |
|
$596,000 |
$3,140 |
$125,420 |
|
Santa Cruz |
17 |
12 |
|
15 |
|
$902,500 |
$4,750 |
$189,910 |
|
Central Valley |
|
|
|
|
|
|
|
|
|
Fresno |
48 |
46 |
|
48 |
R |
$272,500 |
$1,430 |
$57,340 |
|
Kern |
50 |
53 |
|
56 |
|
$245,000 |
$1,290 |
$51,560 |
|
Kings |
57 |
50 |
|
52 |
|
$224,950 |
$1,180 |
$47,340 |
|
Madera |
52 |
47 |
|
49 |
R |
$260,000 |
$1,370 |
$54,710 |
|
Merced |
46 |
40 |
|
43 |
|
$275,000 |
$1,450 |
$57,870 |
|
Placer |
46 |
42 |
|
44 |
|
$480,670 |
$2,530 |
$101,150 |
|
Sacramento |
44 |
42 |
|
44 |
|
$360,000 |
$1,890 |
$75,750 |
|
San Benito |
31 |
28 |
|
32 |
|
$610,000 |
$3,210 |
$128,360 |
|
San Joaquin |
43 |
38 |
|
40 |
|
$365,000 |
$1,920 |
$76,810 |
|
Stanislaus |
47 |
45 |
|
48 |
|
$314,000 |
$1,650 |
$66,070 |
|
Tulare |
51 |
47 |
|
50 |
|
$232,000 |
$1,220 |
$48,820 |
|
Other Calif. Counties |
|
|
|
|
|
|
|
|
|
Amador |
NA |
NA |
|
45 |
|
NA |
NA |
NA |
|
Butte |
34 |
34 |
|
41 |
|
$361,100 |
$1,900 |
$75,990 |
|
Calaveras |
47 |
45 |
|
46 |
|
$320,000 |
$1,680 |
$67,340 |
|
El Dorado |
40 |
42 |
|
42 |
|
$489,000 |
$2,570 |
$102,900 |
|
Humboldt |
36 |
33 |
|
36 |
|
$312,500 |
$1,640 |
$65,760 |
|
Lake |
44 |
40 |
|
40 |
|
$255,000 |
$1,340 |
$53,660 |
|
Lassen |
63 |
66 |
|
68 |
|
$197,000 |
$1,040 |
$41,450 |
|
Mariposa |
41 |
38 |
|
44 |
|
$310,000 |
$1,630 |
$65,230 |
|
Mendocino |
28 |
23 |
|
25 |
|
$385,500 |
$2,030 |
$81,120 |
|
Mono |
10 |
12 |
|
8 |
|
$775,000 |
$4,080 |
$163,080 |
|
Nevada |
40 |
35 |
|
37 |
|
$402,500 |
$2,120 |
$84,700 |
|
Plumas |
48 |
42 |
|
47 |
|
$280,000 |
$1,470 |
$58,920 |
|
Shasta |
44 |
45 |
|
49 |
|
$284,000 |
$1,490 |
$59,760 |
|
Siskiyou |
53 |
50 |
|
48 |
|
$199,500 |
$1,050 |
$41,980 |
|
Sutter |
46 |
44 |
|
49 |
|
$295,000 |
$1,550 |
$62,080 |
|
Tehama |
43 |
46 |
|
51 |
|
$257,500 |
$1,350 |
$54,190 |
|
Tuolumne |
45 |
48 |
|
49 |
|
$304,500 |
$1,600 |
$64,080 |
|
Yolo |
39 |
37 |
|
41 |
|
$432,500 |
$2,280 |
$91,010 |
|
Yuba |
46 |
44 |
|
49 |
|
$289,000 |
$1,520 |
$60,810 |
R = revised
NA = not available
For release:
May 14, 2019
California housing affordability climbs in first quarter 2019, C.A.R. reports
|
click to view |
LOS ANGELES (May 14) – More Californians could afford to purchase a home in the first quarter of 2019 as lower mortgage interest rates and cooler seasonal home prices combined with higher income levels to improve California housing affordability, the CALIFORNIA ASSOCIATION OF REALTORS® (C.A.R.) said today.
The percentage of home buyers who could afford to purchase a median-priced, existing single-family home in California in first-quarter 2019 rose to 32 percent from 28 percent in the fourth quarter of 2018 and from 31 percent in the first quarter a year ago, according to C.A.R.'s Traditional Housing Affordability Index (HAI). The index climbed above 30 percent for the first time in a year. California's housing affordability index hit a peak of 56 percent in the first quarter of 2012.
C.A.R.'s HAI measures the percentage of all households that can afford to purchase a median-priced, single-family home in California. C.A.R. also reports affordability indices for regions and select counties within the state. The index is considered the most fundamental measure of housing well-being for home buyers in the state.
A minimum annual income of $114,860 was needed to qualify for the purchase of a $545,820 statewide median-priced, existing single-family home in the first quarter of 2019. The monthly payment, including taxes and insurance on a 30-year, fixed-rate loan, would be $2,870, assuming a 20 percent down payment and an effective composite interest rate of 4.62 percent. The effective composite interest rate was 4.95 percent in fourth-quarter 2018 and 4.44 percent in first-quarter 2018.
Housing affordability for condominiums and townhomes also improved in first-quarter 2019 compared to the previous quarter, with 41 percent of California households earning the minimum income to qualify for the purchase of a $450,000 median-priced condominium/townhome, up from 37 percent in the previous quarter. An annual income of $94,690 was required to make monthly payments of $2,370. Thirty-nine percent of households could afford to buy a condominium/townhome a year ago.
Compared with California, more than half of the nation's households (57 percent) could afford to purchase a $254,800 median-priced home, which required a minimum annual income of $53,620 to make monthly payments of $1,340.
Key points from the first-quarter 2019 Housing Affordability report include:
- Housing affordability improved from first-quarter 2018 in 28 tracked counties and declined in 16 counties. Affordability in four counties remained flat.
- In the San Francisco Bay Area, affordability improved from a year ago in every county. San Francisco County was the least affordable, with just 17 percent of households able to purchase the $1,532,500 median-priced home. Forty-six percent of Solano County households could afford the $430,500 median-priced home, making it the most affordable Bay Area county.
- Affordability results in the Southern California region were mixed as only Orange and San Diego counties recorded an improvement from a year ago, while San Bernardino and Ventura counties experienced a decline. Affordability was unchanged in Los Angeles and Riverside counties.
- In the Central Valley region, affordability held even from a year ago only in two counties — Fresno and Sacramento — and fell in three counties — Kern, San Benito and Stanislaus. Kings, Madera, Merced, Placer, San Joaquin and Tulare counties recorded improvements.
- Housing affordability improved in all four counties in the Central Coast region, which includes Monterey, San Luis Obispo, Santa Barbara and Santa Cruz counties.
- During the first quarter of 2019, the most affordable counties in California were Lassen (63 percent), Kings (57 percent) and Siskiyou (53 percent). The minimum annual income needed to qualify for a home in these counties was $47,340 or less.
- Mono (10 percent), San Francisco (17 percent), Santa Cruz (17 percent) and San Mateo (18 percent) counties were the least affordable areas in the state. San Francisco and San Mateo counties required the highest minimum qualifying incomes in the state. An annual income of $322,480 was needed to purchase a home in San Francisco County, and an annual income of $323,010 was required in San Mateo County.
See C.A.R.'s historical housing affordability data.
See first-time buyer housing affordability data.
Leading the way…® in California real estate for more than 110 years, the CALIFORNIA ASSOCIATION OF REALTORS® (www.car.org) is one of the largest state trade organizations in the United States with more than 200,000 members dedicated to the advancement of professionalism in real estate. C.A.R. is headquartered in Los Angeles.
# # #
CALIFORNIA ASSOCIATION OF REALTORS®
Traditional Housing Affordability Index
First quarter 2019
|
STATE/REGION/COUNTY |
1st Qtr. 2019 |
4th Qtr. 2018 |
|
1st Qtr. 2018 |
|
Median Home Price |
Monthly Payment Including Taxes & Insurance |
Minimum Qualifying Income |
|
Calif. Single-family home |
32 |
28 |
|
31 |
|
$545,820 |
$2,870 |
$114,860 |
|
Calif. Condo/Townhome |
41 |
37 |
|
39 |
|
$450,000 |
$2,370 |
$94,690 |
|
Los Angeles Metro Area |
33 |
30 |
|
32 |
|
$509,000 |
$2,680 |
$107,110 |
|
Inland Empire |
42 |
40 |
|
43 |
|
$365,000 |
$1,920 |
$76,810 |
|
San Francisco Bay Area |
26 |
22 |
|
23 |
|
$885,000 |
$4,660 |
$186,230 |
|
United States |
57 |
54 |
|
57 |
|
$254,800 |
$1,340 |
$53,620 |
|
|
|
|
|
|
|
|
|
|
|
San Francisco Bay Area |
|
|
|
|
|
|
|
|
|
Alameda |
25 |
20 |
|
22 |
|
$865,000 |
$4,550 |
$182,020 |
|
Contra Costa |
37 |
33 |
|
36 |
|
$630,000 |
$3,310 |
$132,570 |
|
Marin |
21 |
19 |
|
18 |
|
$1,250,000 |
$6,580 |
$263,040 |
|
Napa |
29 |
25 |
|
28 |
|
$672,500 |
$3,540 |
$141,510 |
|
San Francisco |
17 |
15 |
|
15 |
|
$1,532,500 |
$8,060 |
$322,480 |
|
San Mateo |
18 |
15 |
|
15 |
|
$1,535,000 |
$8,080 |
$323,010 |
|
Santa Clara |
20 |
18 |
|
17 |
|
$1,220,000 |
$6,420 |
$256,720 |
|
Solano |
46 |
39 |
|
42 |
|
$430,500 |
$2,260 |
$90,590 |
|
Sonoma |
27 |
23 |
|
21 |
|
$632,500 |
$3,330 |
$133,100 |
|
Southern California |
|
|
|
|
|
|
|
|
|
Los Angeles |
28 |
24 |
|
28 |
|
$548,630 |
$2,890 |
$115,450 |
|
Orange |
24 |
20 |
|
21 |
|
$800,000 |
$4,210 |
$168,340 |
|
Riverside |
39 |
37 |
|
39 |
|
$409,000 |
$2,150 |
$86,070 |
|
San Bernardino |
50 |
48 |
|
52 |
|
$299,950 |
$1,580 |
$63,120 |
|
San Diego |
27 |
24 |
|
26 |
|
$620,000 |
$3,260 |
$130,470 |
|
Ventura |
29 |
29 |
|
31 |
|
$630,240 |
$3,320 |
$132,620 |
|
Central Coast |
|
|
|
|
|
|
|
|
|
Monterey |
25 |
21 |
|
23 |
|
$585,000 |
$3,080 |
$123,100 |
|
San Luis Obispo |
26 |
22 |
|
25 |
|
$602,000 |
$3,170 |
$126,680 |
|
Santa Barbara |
25 |
26 |
R |
22 |
|
$596,000 |
$3,140 |
$125,420 |
|
Santa Cruz |
17 |
12 |
|
15 |
|
$902,500 |
$4,750 |
$189,910 |
|
Central Valley |
|
|
|
|
|
|
|
|
|
Fresno |
48 |
46 |
|
48 |
R |
$272,500 |
$1,430 |
$57,340 |
|
Kern |
50 |
53 |
|
56 |
|
$245,000 |
$1,290 |
$51,560 |
|
Kings |
57 |
50 |
|
52 |
|
$224,950 |
$1,180 |
$47,340 |
|
Madera |
52 |
47 |
|
49 |
R |
$260,000 |
$1,370 |
$54,710 |
|
Merced |
46 |
40 |
|
43 |
|
$275,000 |
$1,450 |
$57,870 |
|
Placer |
46 |
42 |
|
44 |
|
$480,670 |
$2,530 |
$101,150 |
|
Sacramento |
44 |
42 |
|
44 |
|
$360,000 |
$1,890 |
$75,750 |
|
San Benito |
31 |
28 |
|
32 |
|
$610,000 |
$3,210 |
$128,360 |
|
San Joaquin |
43 |
38 |
|
40 |
|
$365,000 |
$1,920 |
$76,810 |
|
Stanislaus |
47 |
45 |
|
48 |
|
$314,000 |
$1,650 |
$66,070 |
|
Tulare |
51 |
47 |
|
50 |
|
$232,000 |
$1,220 |
$48,820 |
|
Other Calif. Counties |
|
|
|
|
|
|
|
|
|
Amador |
NA |
NA |
|
45 |
|
NA |
NA |
NA |
|
Butte |
34 |
34 |
|
41 |
|
$361,100 |
$1,900 |
$75,990 |
|
Calaveras |
47 |
45 |
|
46 |
|
$320,000 |
$1,680 |
$67,340 |
|
El Dorado |
40 |
42 |
|
42 |
|
$489,000 |
$2,570 |
$102,900 |
|
Humboldt |
36 |
33 |
|
36 |
|
$312,500 |
$1,640 |
$65,760 |
|
Lake |
44 |
40 |
|
40 |
|
$255,000 |
$1,340 |
$53,660 |
|
Lassen |
63 |
66 |
|
68 |
|
$197,000 |
$1,040 |
$41,450 |
|
Mariposa |
41 |
38 |
|
44 |
|
$310,000 |
$1,630 |
$65,230 |
|
Mendocino |
28 |
23 |
|
25 |
|
$385,500 |
$2,030 |
$81,120 |
|
Mono |
10 |
12 |
|
8 |
|
$775,000 |
$4,080 |
$163,080 |
|
Nevada |
40 |
35 |
|
37 |
|
$402,500 |
$2,120 |
$84,700 |
|
Plumas |
48 |
42 |
|
47 |
|
$280,000 |
$1,470 |
$58,920 |
|
Shasta |
44 |
45 |
|
49 |
|
$284,000 |
$1,490 |
$59,760 |
|
Siskiyou |
53 |
50 |
|
48 |
|
$199,500 |
$1,050 |
$41,980 |
|
Sutter |
46 |
44 |
|
49 |
|
$295,000 |
$1,550 |
$62,080 |
|
Tehama |
43 |
46 |
|
51 |
|
$257,500 |
$1,350 |
$54,190 |
|
Tuolumne |
45 |
48 |
|
49 |
|
$304,500 |
$1,600 |
$64,080 |
|
Yolo |
39 |
37 |
|
41 |
|
$432,500 |
$2,280 |
$91,010 |
|
Yuba |
46 |
44 |
|
49 |
|
$289,000 |
$1,520 |
$60,810 |
R = revised
NA = not available
14
A Profitable Investment: Growing Wealth Through Vacation Rental Income
A Profitable Investment: Growing Wealth Through Vacation Rental Income

The proliferation of sites like Airbnb, VRBO, and HomeAway has given the U.S. private accommodations market a boost, making vacation rentals a popular option for vacationers who want something more to choose from than a hotel. That's created a strong real estate market for first-time investors looking to grow wealth. It can be a highly profitable investment if planned and managed carefully. Here are some factors to consider if you're considering purchasing a vacation rental property:
Location!
17
April 2019 Home Sale Stats
California home sales stumble into spring home buying season as median price sets another record
|
- Existing, single-family home sales totaled 396,760 in April on a seasonally adjusted annualized rate, down 0.1 percent from March and down 4.8 percent from April 2018. - April's statewide median home price was $602,920, up 6.5 percent from March and up 3.2 percent from April 2018. - Sales of condominiums/townhomes were down 3.8 percent from a year ago in April, while the median price was $470,000. - Year-to-date sales were down 7.3 percent in April. |
 Click here to view |
LOS ANGELES (May 16) – California home sales remained muted entering the spring homebuying season as soft buyer demand continues to challenge the market, the CALIFORNIA ASSOCIATION OF REALTORS® (C.A.R.) said today.
Closed escrow sales of existing, single-family detached homes in California totaled a seasonally adjusted annualized rate of 396,760 units in April, according to information collected by C.A.R. from more than 90 local REALTOR® associations and MLSs statewide. The statewide annualized sales figure represents what would be the total number of homes sold during 2019 if sales maintained the April pace throughout the year. It is adjusted to account for seasonal factors that typically influence home sales.
April's sales figure was down 0.1 percent from the 397,210 level in March and down 4.8 percent from home sales in April 2018 of 416,750. Sales remained below the 400,000 level for the ninth consecutive month and have fallen on a year-over-year basis for a full year.
"Weak buyer demand, largely prompted by elevated home prices, is playing a role in the softening housing market," said C.A.R. President Jared Martin. "However, with low interest rates, cooling competition and an increase in homes to choose from, buyers can take advantage of a more balanced housing market."
Even as demand weakened and home sales stumbled, the statewide median home price set another record high in April, hitting $602,920 and surpassing the previous high of $602,760 set last summer. April's price was up 6.5 percent from $565,880 in March and up 3.2 percent from a revised $584,460 in April 2018. The year-over-year price growth rate was the strongest since October 2018.
"While we started off the spring homebuying season on a down note, home sales in the upcoming months may fare better than the top-level numbers suggest," said C.A.R. Senior Vice President and Chief Economist Leslie Appleton-Young. "The year-over-year sales decrease was the smallest in nine months, and pending home sales increased for the second straight month after declining for more than two years. While we don't expect a sharp sales rebound, we also don't expect an acceleration in declines."
Other key points from C.A.R.'s April 2019 resale housing report include:
- Sales dropped on a non-seasonally adjusted annual basis in all major regions, with the Central Valley region experiencing the smallest decline (0.4 percent) and the Inland Empire region recording the largest decrease (7.0 percent).
- Non-seasonally adjusted sales in the San Francisco Bay Area were down 1.0 percent from April 2018. Alameda, Marin, San Francisco and San Mateo counties posted annual sales increases while Contra Costa, Santa Clara, Solano and Sonoma saw declines. Sales in Napa County were flat compared to a year ago.
- The Los Angeles Metro region posted a non-seasonally adjusted year-over-year sales drop of 2 percent, with home sales declining in Los Angeles, Riverside and San Bernardino counties. Sales improved from a year ago in Orange and Ventura counties.
- The median home price increased from a year ago in all regions except the San Francisco Bay Area. Of the entire nine-county region, only Napa County posted an increase in April of 3.3 percent, while San Mateo, Santa Clara and Sonoma recorded the largest price declines of 9.5 percent, 7.7 percent and 5.8 percent, respectively.
- Conversely, home prices rose on a year-to-year basis across Southern California, with the exception of Ventura County, which was down 2.3 percent. Price growth remains strongest in the Inland Empire, where homes are most affordable, with prices in both Riverside and San Bernardino counties increasing more than 5 percent.
- In the Central Valley, home prices were up across the board, with overall prices for the region rising 1.8 percent from a year ago.
- Home prices in the Central Coast region increased 5.7 percent on a year-over-year basis.
- Encouragingly, the growth in active listings from the year prior decelerated for the fourth straight month. The number of homes available for sale increased only 10.8 percent from last April, but still enough to provide a much-needed supply of homes for sale. The growth in active listings has fallen from more than 30 percent at the end of 2018 suggesting that the market is becoming more balanced, rather than experiencing a full-scale exodus of sellers in California.
- The Unsold Inventory Index (UII), which is a ratio of inventory over sales, dipped on a month-to-month basis but edged up on a year-over-year basis. The Unsold Inventory Index was 3.4 months in April, down from 3.6 months in March but up from 3.2 months in April 2018. The index measures the number of months it would take to sell the supply of homes on the market at the current sales rate. The jump in the UII from a year ago can be attributed to the moderate sales decline and the sharp increase in active listings.
- The median number of days it took to sell a California single-family home is increasing. Time on market fell from 25 days in March to 21 days in April as the homebuying season got underway. However, it took a median number of 15 days to sell a home in April 2018.
- C.A.R.'s statewide sales-price-to-list-price ratio* was 98.9 percent in April 2019 compared to 100 percent in April 2018.
- The average statewide price per square foot** for an existing, single-family home statewide reached $290 in April 2019, up from $281 in April 2018. The April 2019 figure was the highest level since late 2007.
- The 30-year, fixed-mortgage interest rate averaged 4.14 percent in April, down from 4.47 percent in April 2018, according to Freddie Mac. The five-year, adjustable mortgage interest rate increased in April to an average of 3.75 percent from 3.66 in April 2018.
Note: The County MLS median price and sales data in the tables are generated from a survey of more than 90 associations of REALTORS®throughout the state and represent statistics of existing single-family detached homes only. County sales data are not adjusted to account for seasonal factors that can influence home sales. Movements in sales prices should not be interpreted as changes in the cost of a standard home. The median price is where half sold for more and half sold for less; medians are more typical than average prices, which are skewed by a relatively small share of transactions at either the lower-end or the upper-end. Median prices can be influenced by changes in cost, as well as changes in the characteristics and the size of homes sold. The change in median prices should not be construed as actual price changes in specific homes.
*Sales-to-list-price ratio is an indicator that reflects the negotiation power of home buyers and home sellers under current market conditions. The ratio is calculated by dividing the final sales price of a property by its last list price and is expressed as a percentage. A sales-to-list ratio with 100 percent or above suggests that the property sold for more than the list price, and a ratio below 100 percent indicates that the price sold below the asking price.
**Price per square foot is a measure commonly used by real estate agents and brokers to determine how much a square foot of space a buyer will pay for a property. It is calculated as the sale price of the home divided by the number of finished square feet. C.A.R. currently tracks price-per-square foot statistics for 50 counties.
Leading the way…® in California real estate for more than 110 years, the CALIFORNIA ASSOCIATION OF REALTORS® (www.car.org) is one of the largest state trade organizations in the United States with more than 200,000 members dedicated to the advancement of professionalism in real estate. C.A.R. is headquartered in Los Angeles.
# # #
April 2019 County Sales and Price Activity
(Regional and condo sales data not seasonally adjusted)
|
April 2019 |
Median Sold Price of Existing Single-Family Homes |
Sales |
|||||||
|
State/Region/County |
April 2019 |
March 2019 |
|
April 2018 |
|
Price MTM% Chg |
Price YTY% Chg |
Sales MTM% Chg |
Sales YTY% Chg |
|
Calif. Single-family home |
$602,920 |
$565,880 |
|
$584,460 |
|
6.5% |
3.2% |
-0.1% |
-4.8% |
|
Calif. Condo/Townhome |
$470,000 |
$465,000 |
|
$471,500 |
r |
1.1% |
-0.3% |
13.4% |
-3.8% |
|
Los Angeles Metro Area |
$536,450 |
$517,000 |
|
$515,000 |
|
3.8% |
4.2% |
13.9% |
-2.0% |
|
Central Coast |
$699,450 |
$645,000 |
|
$661,750 |
|
8.4% |
5.7% |
5.6% |
-4.1% |
|
Central Valley |
$330,730 |
$325,000 |
|
$325,000 |
|
1.8% |
1.8% |
10.1% |
-0.4% |
|
Inland Empire |
$378,240 |
$374,900 |
|
$360,000 |
|
0.9% |
5.1% |
6.8% |
-7.0% |
|
San Francisco Bay Area |
$988,000 |
$940,000 |
|
$1,010,000 |
r |
5.1% |
-2.2% |
17.8% |
-1.0% |
|
|
|
|
|
|
|
|
|
|
|
|
|
|
|
|
|
|
|
|
|
|
|
San Francisco Bay Area |
|
|
|
|
|
|
|
|
|
|
Alameda |
$940,000 |
$911,000 |
|
$969,300 |
|
3.2% |
-3.0% |
20.4% |
2.4% |
|
Contra Costa |
$679,000 |
$644,000 |
|
$689,660 |
|
5.4% |
-1.5% |
11.8% |
-4.8% |
|
Marin |
$1,350,000 |
$1,300,000 |
|
$1,385,000 |
|
3.8% |
-2.5% |
44.9% |
2.9% |
|
Napa |
$705,000 |
$699,000 |
|
$682,500 |
|
0.9% |
3.3% |
44.6% |
0.0% |
|
San Francisco |
$1,632,500 |
$1,637,500 |
|
$1,650,000 |
|
-0.3% |
-1.1% |
27.1% |
16.1% |
|
San Mateo |
$1,601,000 |
$1,610,000 |
|
$1,770,000 |
|
-0.6% |
-9.5% |
22.5% |
10.4% |
|
Santa Clara |
$1,315,000 |
$1,300,000 |
|
$1,425,000 |
|
1.2% |
-7.7% |
12.1% |
-8.4% |
|
Solano |
$435,000 |
$438,500 |
|
$447,500 |
|
-0.8% |
-2.8% |
4.8% |
-0.5% |
|
Sonoma |
$645,000 |
$633,750 |
|
$685,000 |
|
1.8% |
-5.8% |
29.0% |
-2.0% |
|
Southern California |
|
|
|
|
|
|
|
|
|
|
Los Angeles |
$544,170 |
$525,520 |
|
$528,550 |
|
3.5% |
3.0% |
18.2% |
-0.1% |
|
Orange |
$825,000 |
$809,500 |
|
$818,000 |
|
1.9% |
0.9% |
17.1% |
0.5% |
|
Riverside |
$423,000 |
$412,000 |
|
$400,000 |
|
2.7% |
5.8% |
7.4% |
-6.5% |
|
San Bernardino |
$305,000 |
$309,950 |
|
$289,900 |
|
-1.6% |
5.2% |
5.8% |
-7.7% |
|
San Diego |
$649,000 |
$623,800 |
|
$635,000 |
|
4.0% |
2.2% |
13.7% |
2.4% |
|
Ventura |
$650,000 |
$640,000 |
|
$665,000 |
|
1.6% |
-2.3% |
27.8% |
15.2% |
|
Central Coast |
|
|
|
|
|
|
|
|
|
|
Monterey |
$600,000 |
$579,000 |
|
$607,750 |
|
3.6% |
-1.3% |
11.9% |
-4.7% |
|
San Luis Obispo |
$650,000 |
$629,500 |
|
$597,505 |
|
3.3% |
8.8% |
9.5% |
3.5% |
|
Santa Barbara |
$760,500 |
$555,000 |
|
$650,000 |
|
37.0% |
17.0% |
-8.9% |
-4.0% |
|
Santa Cruz |
$977,750 |
$918,000 |
|
$899,000 |
|
6.5% |
8.8% |
15.4% |
-15.0% |
|
Central Valley |
|
|
|
|
|
|
|
|
|
|
Fresno |
$271,250 |
$280,000 |
|
$260,000 |
|
-3.1% |
4.3% |
6.1% |
-6.5% |
|
Glenn |
$241,250 |
$250,000 |
|
$215,000 |
|
-3.5% |
12.2% |
-18.5% |
69.2% |
|
Kern |
$250,000 |
$249,950 |
|
$235,000 |
|
0.0% |
6.4% |
12.9% |
16.0% |
|
Kings |
$240,000 |
$232,000 |
|
$235,000 |
|
3.4% |
2.1% |
-10.5% |
-23.8% |
|
Madera |
$271,950 |
$265,000 |
|
$244,000 |
|
2.6% |
11.5% |
43.7% |
18.8% |
|
Merced |
$276,000 |
$275,000 |
|
$259,000 |
|
0.4% |
6.6% |
22.5% |
22.5% |
|
Placer |
$498,500 |
$475,000 |
|
$489,000 |
|
4.9% |
1.9% |
13.1% |
-4.7% |
|
Sacramento |
$385,000 |
$365,000 |
|
$369,000 |
|
5.5% |
4.3% |
12.2% |
-6.8% |
|
San Benito |
$550,900 |
$610,000 |
|
$569,217 |
|
-9.7% |
-3.2% |
32.5% |
-10.2% |
|
San Joaquin |
$375,000 |
$355,000 |
|
$374,990 |
|
5.6% |
0.0% |
11.2% |
6.9% |
|
Stanislaus |
$319,500 |
$320,000 |
|
$306,000 |
|
-0.2% |
4.4% |
7.1% |
1.1% |
|
Tulare |
$244,950 |
$230,000 |
|
$229,250 |
|
6.5% |
6.8% |
-7.5% |
4.1% |
|
Other Calif. Counties |
|
|
|
|
|
|
|
|
|
|
Amador |
NA |
NA |
|
$335,000 |
|
NA |
NA |
NA |
NA |
|
Butte |
$360,000 |
$369,000 |
|
$316,000 |
|
-2.4% |
13.9% |
-27.3% |
-4.3% |
|
Calaveras |
$340,000 |
$308,250 |
|
$340,000 |
|
10.3% |
0.0% |
-5.4% |
-10.3% |
|
Del Norte |
$216,500 |
$253,025 |
|
$239,000 |
|
-14.4% |
-9.4% |
90.0% |
-17.4% |
|
El Dorado |
$524,000 |
$506,165 |
|
$499,999 |
|
3.5% |
4.8% |
-1.3% |
-20.2% |
|
Humboldt |
$305,000 |
$310,000 |
|
$309,000 |
|
-1.6% |
-1.3% |
0.9% |
-1.7% |
|
Lake |
$262,400 |
$243,500 |
|
$285,000 |
|
7.8% |
-7.9% |
18.0% |
-24.4% |
|
Lassen |
$200,950 |
$220,000 |
|
$155,500 |
|
-8.7% |
29.2% |
-4.8% |
33.3% |
|
Mariposa |
$286,500 |
$277,500 |
|
$344,850 |
|
3.2% |
-16.9% |
20.0% |
-29.4% |
|
Mendocino |
$418,500 |
$394,500 |
|
$430,000 |
|
6.1% |
-2.7% |
22.2% |
25.7% |
|
Mono |
$717,250 |
$800,000 |
|
$520,000 |
|
-10.3% |
37.9% |
433.3% |
128.6% |
|
Nevada |
$397,000 |
$412,500 |
|
$408,738 |
|
-3.8% |
-2.9% |
1.6% |
12.7% |
|
Plumas |
$395,000 |
$287,500 |
|
$280,250 |
|
37.4% |
40.9% |
0.0% |
116.7% |
|
Shasta |
$275,000 |
$285,000 |
|
$258,950 |
|
-3.5% |
6.2% |
-1.9% |
0.0% |
|
Siskiyou |
$208,500 |
$205,000 |
|
$217,250 |
|
1.7% |
-4.0% |
-2.2% |
29.4% |
|
Sutter |
$305,000 |
$310,000 |
|
$280,000 |
|
-1.6% |
8.9% |
11.5% |
-9.3% |
|
Tehama |
$232,500 |
$315,000 |
|
$210,000 |
|
-26.2% |
10.7% |
-6.1% |
12.2% |
|
Tuolumne |
$316,000 |
$315,000 |
|
$305,000 |
|
0.3% |
3.6% |
18.0% |
-15.3% |
|
Yolo |
$419,330 |
$450,000 |
|
$495,000 |
|
-6.8% |
-15.3% |
21.8% |
-8.8% |
|
Yuba |
$268,000 |
$290,000 |
|
$285,000 |
|
-7.6% |
-6.0% |
1.4% |
-6.3% |
r = revised
NA = not available
April 2019 County Unsold Inventory and Days on Market
(Regional and condo sales data not seasonally adjusted)
|
April 2019 |
Unsold Inventory Index |
Median Time on Market |
||||||||
|
State/Region/County |
April 2019 |
March 2019 |
|
April 2018 |
|
April 2019 |
March 2019 |
|
April 2018 |
|
|
Calif. Single-family home |
3.4 |
3.6 |
|
3.2 |
|
21.0 |
25.0 |
|
15.0 |
|
|
Calif. Condo/Townhome |
3.1 |
3.3 |
|
2.4 |
|
22.0 |
24.0 |
|
12.0 |
|
|
Los Angeles Metro Area |
3.9 |
4.1 |
3.6 |
|
30.0 |
33.0 |
|
21.0 |
|
|
|
Central Coast |
4.3 |
4.1 |
|
3.9 |
|
23.0 |
26.0 |
|
17.5 |
|
|
Central Valley |
3.0 |
3.0 |
|
2.8 |
|
16.0 |
22.0 |
|
13.0 |
|
|
Inland Empire |
4.1 |
4.2 |
|
3.7 |
|
37.0 |
42.0 |
|
29.0 |
|
|
San Francisco Bay Area |
2.6 |
2.6 |
|
2.1 |
|
15.0 |
16.0 |
|
12.0 |
r |
|
|
|
|
|
|
|
|
|
|
|
|
|
San Francisco Bay Area |
|
|
|
|
|
|
|
|
|
|
|
Alameda |
2.0 |
2.2 |
|
1.7 |
|
13.0 |
13.0 |
|
10.0 |
|
|
Contra Costa |
2.7 |
2.6 |
|
2.1 |
|
13.0 |
14.0 |
|
11.0 |
|
|
Marin |
3.1 |
3.8 |
|
2.7 |
|
24.0 |
28.0 |
|
22.0 |
|
|
Napa |
5.8 |
6.8 |
|
4.3 |
|
49.5 |
73.0 |
|
37.5 |
|
|
San Francisco |
1.6 |
1.8 |
|
1.9 |
|
15.0 |
14.0 |
|
14.0 |
|
|
San Mateo |
2.0 |
2.2 |
|
1.9 |
|
12.0 |
13.0 |
|
10.0 |
|
|
Santa Clara |
2.4 |
2.3 |
|
1.6 |
|
11.0 |
12.0 |
|
8.0 |
|
|
Solano |
3.0 |
2.8 |
|
2.6 |
|
33.0 |
37.0 |
|
29.0 |
|
|
Sonoma |
4.0 |
4.1 |
|
3.0 |
|
33.5 |
43.5 |
|
33.0 |
|
|
Southern California |
|
|
|
|
|
|
|
|
|
|
|
Los Angeles |
3.5 |
3.8 |
|
3.3 |
|
24.0 |
25.0 |
|
17.0 |
|
|
Orange |
3.8 |
4.3 |
|
3.5 |
|
21.0 |
25.0 |
|
14.0 |
|
|
Riverside |
4.1 |
4.3 |
|
3.6 |
|
39.0 |
44.0 |
|
29.0 |
|
|
San Bernardino |
4.1 |
4.1 |
|
3.9 |
|
35.0 |
40.0 |
|
28.0 |
|
|
San Diego |
3.1 |
3.4 |
|
3.0 |
|
17.0 |
19.0 |
|
11.0 |
|
|
Ventura |
4.9 |
5.8 |
|
5.5 |
|
47.0 |
51.0 |
|
39.0 |
|
|
Central Coast |
|
|
|
|
|
|
|
|
|
|
|
Monterey |
4.0 |
4.2 |
|
3.8 |
|
27.0 |
27.0 |
|
22.0 |
|
|
San Luis Obispo |
4.5 |
4.5 |
|
4.3 |
|
22.0 |
33.0 |
|
19.5 |
|
|
Santa Barbara |
4.8 |
3.9 |
|
4.5 |
|
27.0 |
26.0 |
|
20.5 |
|
|
Santa Cruz |
3.6 |
3.6 |
|
2.7 |
|
14.0 |
20.0 |
|
11.0 |
|
|
Central Valley |
|
|
|
|
|
|
|
|
|
|
|
Fresno |
3.4 |
3.4 |
|
2.8 |
|
17.0 |
26.0 |
|
12.0 |
|
|
Glenn |
3.8 |
2.8 |
|
6.1 |
|
20.5 |
45.0 |
|
16.0 |
|
|
Kern |
2.8 |
3.0 |
|
3.5 |
|
12.0 |
21.0 |
|
19.0 |
|
|
Kings |
4.6 |
3.8 |
|
2.9 |
|
24.0 |
34.0 |
|
16.0 |
|
|
Madera |
4.3 |
6.1 |
|
4.9 |
|
36.0 |
37.0 |
|
19.0 |
|
|
Merced |
3.8 |
4.3 |
|
4.1 |
|
26.0 |
55.0 |
|
28.0 |
|
|
Placer |
2.8 |
2.7 |
|
2.5 |
|
14.0 |
17.5 |
|
10.0 |
|
|
Sacramento |
2.2 |
2.3 |
|
2.2 |
|
11.0 |
18.0 |
|
10.0 |
|
|
San Benito |
3.4 |
4.0 |
|
2.5 |
|
31.0 |
63.0 |
|
13.0 |
|
|
San Joaquin |
3.0 |
3.2 |
|
2.8 |
|
17.0 |
22.0 |
|
12.0 |
|
|
Stanislaus |
2.7 |
2.8 |
|
2.7 |
|
20.0 |
23.0 |
|
13.0 |
|
|
Tulare |
3.7 |
3.3 |
|
3.8 |
|
28.0 |
32.0 |
|
23.0 |
|
|
Other Calif. Counties |
|
|
|
|
|
|
|
|
|
|
|
Amador |
NA |
NA |
|
5.3 |
|
NA |
NA |
|
16.0 |
|
|
Butte |
2.7 |
1.8 |
|
3.2 |
|
7.0 |
9.0 |
|
9.0 |
|
|
Calaveras |
6.4 |
5.0 |
|
5.7 |
|
28.0 |
53.5 |
|
28.0 |
|
|
Del Norte |
6.6 |
12.4 |
|
5.3 |
|
162.0 |
140.0 |
|
145.0 |
|
|
El Dorado |
5.3 |
4.2 |
|
3.5 |
|
30.0 |
32.5 |
|
20.0 |
|
|
Humboldt |
4.9 |
4.5 |
|
5.0 |
|
28.5 |
44.0 |
|
22.0 |
|
|
Lake |
8.3 |
8.8 |
|
6.0 |
|
54.0 |
80.5 |
|
39.5 |
|
|
Lassen |
6.4 |
5.2 |
|
10.5 |
|
96.0 |
90.0 |
|
137.0 |
|
|
Mariposa |
10.1 |
10.4 |
|
6.8 |
|
129.0 |
31.0 |
|
18.0 |
r |
|
Mendocino |
10.0 |
11.1 |
|
12.7 |
|
73.0 |
81.0 |
|
70.0 |
|
|
Mono |
4.6 |
22.7 |
|
10.6 |
|
209.0 |
71.0 |
|
170.0 |
|
|
Nevada |
4.6 |
3.9 |
|
4.7 |
|
43.5 |
44.5 |
|
22.5 |
|
|
Plumas |
11.5 |
9.2 |
|
22.0 |
|
153.5 |
129.0 |
|
178.5 |
|
|
Shasta |
4.2 |
3.7 |
|
4.4 |
|
26.0 |
40.0 |
|
22.0 |
|
|
Siskiyou |
6.7 |
5.8 |
|
7.8 |
|
70.5 |
82.0 |
|
25.0 |
|
|
Sutter |
2.5 |
2.5 |
|
2.9 |
|
19.5 |
14.0 |
|
32.0 |
|
|
Tehama |
4.5 |
3.7 |
|
5.0 |
|
38.0 |
43.0 |
|
55.0 |
|
|
Tuolumne |
5.5 |
5.4 |
|
3.8 |
|
46.0 |
76.5 |
|
23.0 |
|
|
Yolo |
2.7 |
3.0 |
|
2.1 |
|
17.0 |
27.0 |
|
10.0 |
|
|
Yuba |
2.8 |
2.8 |
|
3.0 |
|
12.0 |
19.0 |
|
17.0 |
|
r = revised
NA = not available
17
Why working with a Real Estate Agent benefits for you.
This morning I would like to share with you a pin I found on pinterest. When you are ready to sell your home or land call Sunshine Properties Real Estate they're is always a Realtor ready and available to help. We are open 7 days a week! 760-728-8855
