

Subscribe and receive email notifications of new blog posts.
 RSS Feed
Some or all of the mortgage lenders featured on our site are advertising partners of NerdWallet, but this does not influence our evaluations, lender star ratings or the order in which lenders are listed on the page. Our opinions are our own. Here is a list of our partners.
New American Funding: NMLS#6606
Great for first-time home buyers | customer service
4.0
NerdWallet ratingInsurance $0

NBKC: NMLS#409631
Great for first-time home buyers | digital convenience | customer service
4.5
NerdWallet ratingInsurance $0

on Bethpage Federal Credit Union
Bethpage Federal Credit Union: NMLS#449104
4.5
NerdWallet ratingInsurance $0

Northpointe: NMLS#447490
4.0
NerdWallet ratingInsurance $0
About These Rates: The lenders whose rates appear on this table are NerdWallet's advertising partners. NerdWallet strives to keep its information accurate and up to date. This information may be different than what you see when you visit a lender's site. The terms advertised here are not offers and do not bind any lender. The rates shown here are retrieved via the Mortech rate engine and are subject to change. These rates do not include taxes, fees, and insurance. Your actual rate and loan terms will be determined by the partner's assessment of your creditworthiness and other factors. Any potential savings figures are estimates based on the information provided by you and our advertising partners.
On Thursday, October 12th, 2023, the average APR on a 30-year fixed-rate mortgage fell 9 basis points to 7.505%. The average APR on a 15-year fixed-rate mortgage rose 1 basis point to 6.711% and the average APR for a 5-year adjustable-rate mortgage (ARM) rose 1 basis point to 8.017%, according to rates provided to NerdWallet by Zillow. The 30-year fixed-rate mortgage is 18 basis points lower than one week ago and 65 basis points higher than one year ago.
A basis point is one one-hundredth of one percent. Rates are expressed as annual percentage rate, or APR.
| Product | Interest rate | APR |
|---|---|---|
| 30-year fixed-rate | 7.421% | 7.505% |
| 20-year fixed-rate | 7.367% | 7.468% |
| 15-year fixed-rate | 6.553% | 6.711% |
| 10-year fixed-rate | 6.536% | 6.777% |
| 7-year ARM | 7.372% | 7.947% |
| 5-year ARM | 7.275% | 8.017% |
| 3-year ARM | 6.125% | 7.204% |
| 30-year fixed-rate FHA | 6.750% | 7.608% |
| 30-year fixed-rate VA | 6.514% | 6.920% |
Data source: ©Zillow, Inc. 2006 – 2021. Use is subject to the Terms of Use
Most people don't have the cash to simply buy a house. Instead, they use a mortgage, which is a loan to buy a home. After making a down payment of anywhere from 3% to 25%, they get a mortgage to cover the remaining costs of purchasing the home.
A mortgage is set up so you pay off the loan over a specified period called the term. The most popular term is 30 years. Each payment includes a combination of principal and interest, as well as property taxes, and, if needed, mortgage insurance. (Homeowners insurance may be included, or the homeowner may pay the insurer directly.) Principal is the original amount of money you borrowed while interest is what you're being charged to borrow the money.
The mortgage rate a lender offers you is determined by a mix of factors that are specific to you and larger forces that are beyond your control.
Lenders will have a base rate that takes the big stuff into account and gives them some profit. They adjust that base rate up or down for individual borrowers depending on perceived risk. If you seem like a safe bet to a lender, you're more likely to be offered a lower interest rate.
Factors you can change:
Your credit score. Mortgage lenders use credit scores to evaluate risk. Higher scores are seen as safer. In other words, the lender is more confident that you'll successfully make your mortgage payments.
Your down payment. Paying a larger percentage of the home's price upfront reduces the amount you're borrowing and makes you seem less risky to lenders. You can calculate your loan-to-value ratio to check this out. A LTV of 80% or more is considered high.
Your loan type. The kind of loan you're applying for can influence the mortgage rate you're offered. For example, jumbo loans tend to have higher interest rates.
How you're using the home. Mortgages for primary residences — a place you're actually going to live — generally get lower interest rates than home loans for vacation properties, second homes or investment properties.
Forces you can't control:
The U.S. economy. Sure, this means Wall Street, but non-market forces (for example, elections) can also influence mortgage rates. Changes in inflation and unemployment rates tend to put pressure on interest rates.
The global economy. What's happening around the world will influence U.S. markets. Global political worries can move mortgage rates lower. Good news may push rates higher.
The Federal Reserve. The nation's central bank attempts to guide the economy with the twin goals of encouraging job growth while keeping inflation under control. Decisions made by the Federal Open Market Committee to raise or cut short-term interest rates can sometimes cause lenders to raise or cut mortgage rates.
" MORE: What determines mortgage rates?
Mortgage rates like the ones you see on this page are sample rates. In this case, they're the averages of rates from multiple lenders, which are provided to NerdWallet by Zillow. They let you know about where mortgage rates stand today, but they might not reflect the rate you'll be offered.
When you look at an individual lender's website and see mortgage rates, those are also sample rates. To generate those rates, the lender will use a bunch of assumptions about their "sample" borrower, including credit score, location and down payment amount. Sample rates also sometimes include discount points, which are optional fees borrowers can pay to lower the interest rate. Including discount points will make a lender's rates appear lower.
To see more personalized rates, you'll need to provide some information about you and about the home you want to buy. For example, at the top of this page, you can enter your ZIP code to start comparing rates. On the next page, you can adjust your approximate credit score, the amount you're looking to spend, your down payment amount and the loan term to see rate quotes that better reflect your individual situation.
Whether you're looking at sample rates on lenders' websites or comparing personalized rates here, you'll notice that interest rates vary. This is one reason why it's important to shop around when you're looking for a mortgage lender. Fractions of a percentage might not seem like they'd make a big difference, but you aren't just shaving a few bucks off your monthly mortgage payment, you're also lowering the total amount of interest you'll pay over the life of the loan.
It's a good idea to apply for mortgage preapproval from at least three lenders. With a preapproval, the lenders verify some of the details of your finances, so both the rates offered and the amount you're able to borrow will be real numbers. Each lender will provide you with a Loan Estimate. These standardized forms make it easy to compare interest rates as well as lender fees.
When you're comparing rates, you'll usually see two numbers — the interest rate and the APR. The APR, or annual percentage rate, is usually the higher of the two because it takes into account both the interest rate and the other costs associated with the loan (like those lender fees). Because of this, APR is usually considered a more accurate measure of the cost of borrowing.
" MORE FOR CANADIAN READERS: Best mortgage rates in Canada
The interest rate is the percentage that the lender charges for borrowing the money. The APR, or annual percentage rate, is supposed to reflect a more accurate cost of borrowing. The APR calculation includes fees and discount points, along with the interest rate.
APR is a tool used to compare loan offers, even if they have different interest rates, fees and discount points. APR takes ongoing costs like mortgage insurance into account, which is why it's usually higher than the interest rate.
About the author: Kate writes about mortgages, homebuying and homeownership for NerdWallet. Previously, she covered topics related to homeownership at This Old House magazine.
On October 24, the Farm Bureau of Ventura County will host the free Agri-Tech Fair — an event that will bring together agriculture technology companies, producers, industry leaders and more. Attendees will learn about the latest advancements in agriculture and how they can use these technologies in their operations. A pre-event welcome reception will be held October 23 from 5:00 – 7:00 p.m.
Participants can explore the latest technologies, attend live demonstrations, earn Continuing Education Units and connect with leading industry experts. The exhibition will run from 8:00 a.m. – 5:00 p.m. and will be followed by a networking mixer.
Educati...
For release:
October 9, 2023
California REALTORS® provide additional funding for closing cost grants to underserved first-time homebuyers
LOS ANGELES (Oct. 9) – In a continuing effort to address California's growing housing affordability crisis and racial homeownership divide, the CALIFORNIA ASSOCIATION OF REALTORS®' (C.A.R.) Housing Affordability Fund (HAF) will provide another $500,000 in closing cost assistance for eligible first-time California homebuyers from an underserved community, C.A.R. announced today.
The additional amount brings the total to $2 million in grants for the Pathway to Homeownership grant program in support of the Association's Fair Housing and Diversity efforts. Since 20...
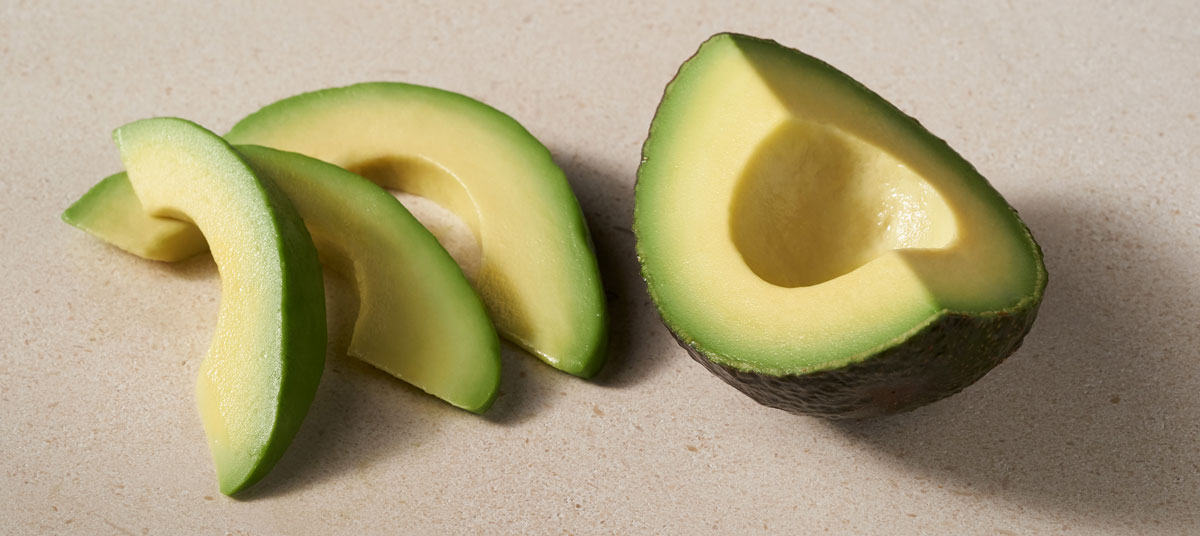
CALIFORNIA AVOCADOS
Avocados are grown on approximately 60,000 acres, primarily in southern and central California, typically in regions tempered by coastal climates. Most of the avocado acreage lies between San Luis Obispo and San Diego. Avocados are produced in 15 counties but five coastal counties account for essentially all of the state's production. Based on 2002 USDA census data, San Diego, Santa Barbara, and Ventura Counties are the top producing counties, accounting for approximately 80% of the total avocado acreage in California (USDA, 2002). San Diego County is the leading county, producing nearly 47% of California market value for avocados (USDA, 1999a), accounting for 39% of the state's avocado producing acreage (USDA, 2002). Other counties with significant production are Riverside (14%) and Orange (3%) counties. California produces 95% of the avocados grown in the United States and 10% of the world's production. From 1990 to 1998, California's average production was 323 million pounds, with typical fluctuations of 5% (USDA, 1999a) This crop requires relatively few chemicals to control insect pests. Beneficial insects are used as part of an Integrated Pest Management (IPM) approach in which harsh chemicals are avoided to maintain this balance.
Several varieties of avocados are harvested in California including, Haas, Lamb Haas, Bacon, Zutano, Fuerte, Pinkerton and Gwen. The Haas variety is the predominant tree accounting for roughly 90% of the total production. Due to California's unique coastal micro-climate, avocados are harvested year round with a typical tree yielding 60 lbs of fruit per year. The official avocado crop year runs from November 1 through October 31. Avocado fruit can be held successfully after harvest in cold storage for approximately 2 to 4 weeks. The size and oil levels of the harvested fruit, in part, determine the grade of the harvest.
Avocados are typically grown in well-drained, fine or course sandy loam soils. Micro sprinkler and drip irrigation systems typically are used to deliver water to the grove floor. Avocado roots are relatively shallow, so deep watering is unnecessary. There are over two-dozen avocado bearing soils in San Diego, Santa Barbara, and Ventura Counties alone (USDA, 2006). Approximately 63% of avocado bearing soils in these counties are in drainage groups C and D. Of these, the Cieneba series is the most common avocado bearing soil with moderate expected yields under irrigation (Table 5). The Cieneba series accounts for approximately 37% of avocado bearing soil acreage (USDA, 2006). Cieneba soils are thermic, shallow Typic Xerorthents located on uplands with slopes of 9 to 85 percent (USDA, 1999b). Location and metfile selections are often the most important developments affecting scenario vulnerability and protectiveness. Because this scenario is intended to represent avocado production along the southern coastal area of California, the metfile closest to the center of the primary avocado producing county (San Diego) was chosen. The Cieneba soil series was selected for this scenario because it is both representative of avocado bearing soils (Oster, 2006), is predominant in San Diego County as well as central and southern California, represents the majority (44%) of avocado soils in drainage, the fourth most erosive soil type, and is among the steeper sloped avocado bearing soils (Table 5).
Cieneba is a Hydrologic Group C soil, which represents the majority (44%) of these soils in drainage. Cieneba soils have a USLE K factor of ranging from 0.24-0.32; approximately 82% of avocado bearing soils have a USLE K factor between 0.24 and 0.32 (Table 5). Approximately 10% of avocado bearing soils have a pH lower than Cieneba soils (5.8 - 6.5), although soil pH is not currently a PRZM input parameter and is not expected to often affect chemical fate in the acidic range. Based on the official soil series description, Ceineba soils have an A horizon from 0 to 10 inches (0-25 cm) deep and a C horizon from 10 to over 30 inches (25-76 cm) deep, however the C horizon is primarily weathered granitic material with remnant rock structure. (USDA, 2006). Cieneba coarse sandy loam was used to parameterize this scenario (USDA 2005).
The Met station chosen was the San Diego station (23188.dvf) located at 32º 44' N, 117º 10' W and at an elevation of approximately 4 meters above sea level. This station receives an average of approximately 25.2 cm of rainfall annually. The station is the closest available station to this scenario with data necessary for PRZM.
|
Table 1. PRZM 3.12 Climate and Time Parameters for San Diego, California – Avocado. |
||
|
Parameter |
Value |
Source/Comments |
|
Starting Date |
Jan. 1, 1961 |
Meteorological File from San Diego County, (W 23188) |
|
Ending Date |
Dec. 31, 1990 |
Meteorological File from San Diego County, (W 23188) |
|
Pan Evaporation Factor (PFAC) |
0.70 |
PRZM Manual Figure 5.1. Value represents San Diego region. |
|
Snowmelt Factor (SFAC) |
0 |
In areas where climatology prevents snow fall, SFAC should be set to 0.0 - PRZM Manual (EPA 1998) |
|
Minimum Depth of Evaporation (ANETD) |
32.5 cm |
PRZM Manual (EPA 1998) Average of 30-35 cm |
|
Table 2. PRZM 3.12 Erosion and Landscape Parameters for San Diego, California – Avocado. |
||
|
Parameter |
Value |
Source/Comments |
|
Method to Calculate Erosion (ERFLAG) |
4 (MUSS) |
PRZM Manual (EPA, 1998) |
|
USLE K Factor (USLEK) |
0.24 |
USDA NRCS Soil Data Mart (http://soildatamart.nrcs.usda.gov/)
|
|
USLE LS Factor (USLELS) |
3.63 |
PRZM Manual (EPA, 1998) LS value for 12% slope and 400' slope length; LS equation (Haan and Barfield, 1978) |
|
USLE P Factor (USLEP) |
1.0 |
Set to 1 for orchards (EPA, 2004) |
|
Field Area (AFIELD) |
172 ha |
Area of Shipman Reservoir watershed (EPA, 1999) |
|
NRCS Hyetograph (IREG) |
1 |
PRZM Manual Figure 5.12 (EPA, 1998) Type I, IREG=1 |
|
Slope (SLP) |
12 % |
Slopes for Cieneba coarse sandy loam exceed 12%. Set to 12% as per PRZM scenario guidance (EPA, 2004). Some data indicate slopes as high as 16% (Oster and Arpaia 2006) |
|
Hydraulic Length (HL) |
600 m |
Shipman Reservoir (EPA, 1999) |
|
Irrigation Flag (IRFLAG) |
1 |
Year round irrigation. EPA, 2005 |
|
Irrigation Type (IRTYP) |
4 (drip) |
Irrigation Guidance for developing PRZM Scenarios, Table 3; (EPA 2005). |
|
Leaching Factor (FLEACH) |
0.0 |
Set to 0 as per Irrigation Guidance for developing PRZM Scenarios, Table 3; (June 15, 2005). |
|
Fraction of Water Capacity when Irrigation is Applied (PCDEPL) |
0.5 |
Set to default as per Irrigation Guidance for developing PRZM Scenarios, Table 3; (EPA 2005). |
|
Maximum Rate at which Irrigation is Applied (RATEAP) |
0.056 cm hr-1 |
Irrigation Guidance for developing PRZM Scenarios, Table 1; (June 15, 2005). For CN = 79 and f = 0 |
|
|
||
|
Table 3. PRZM 3.12 Crop Parameters for San Diego, California – Avocado. |
||
|
Parameter |
Value |
Source/Comments |
|
Initial Crop (INICRP) |
1 |
Set to one for all crops (EPA, 2004). |
|
Initial Surface Condition (ISCOND) |
3 |
Orchard residues are left behind between rows, under trees are cleared to reduce disease. Consistent with the FL avocado scenario and other orchard type scenarios. |
|
Number of Different Crops (NDC) |
1 |
Set to number of crops in simulation. |
|
Number of Cropping Periods (NCPDS) |
30 |
Set to weather data in meteorological file: San Diego, CA (W23188). |
|
Maximum rainfall interception storage of crop (CINTCP) |
0.25 |
Recommended value for orchards (EPA, 2004). |
|
Maximum Active Root Depth (AMXDR) |
25 cm |
Set to horizon depth. Most of the roots for Haas avocados grown in an orchard with Cieneba soil type were located above 15 cm (Oster and Arpaia 2006) |
|
Maximum Canopy Coverage (COVMAX) |
70 |
Taken from FL avocados scenario |
|
Soil Surface Condition After Harvest (ICNAH) |
3 |
Plant residues are left behind. Consistent with the FL avocado scenario and other orchard type scenarios. |
|
Date of Crop Emergence (EMD, EMM, IYREM) |
01/01 |
Values are set to keep E/T and canopy coverage terms working correctly for this evergreen scenario. |
|
Date of Crop Maturity (MAD, MAM, IYRMAT) |
02/01 |
Values are set to keep E/T and canopy coverage terms working correctly for this evergreen scenario. |
|
Date of Crop Harvest (HAD, HAM, IYRHAR) |
31/12 |
Values are set to keep E/T and canopy coverage terms working correctly for this evergreen scenario. |
|
Maximum Dry Weight (WFMAX) |
0.0 |
Not used in scenario |
|
Maximum CropHeight (HTMAX) |
914 |
Avocado trees typically grow to 20-40 feet California Avocado Commission |
|
SCS Curve Number (CN) |
84, 79, 82 |
Gleams Manual Table H-4; meadows; hydrological group C (USDA, 1990) |
|
Manning's N Value (MNGN) |
0.023 |
RUSLE Project; C25CFCFN for California citrus with full cover (USDA, 2000). |
|
USLE C Factor (USLEC) |
0.040 - 0.062 |
RUSLE Project; C25CFCFN for California citrus with full cover (USDA, 2000). |
|
Table 4. PRZM 3.12 Cieneba Soil Parameters for San Diego, California – Avocado. |
||
|
Parameter |
Value |
Source/Comments |
|
Total Soil Depth (CORED) |
25 cm |
NRCS Soil Data Mart (SDM) (http://soildatamart.nrcs.usda.gov) |
|
Number of Horizons (NHORIZ) |
2 |
NRCS Soil Data Mart (SDM) (http://soildatamart.nrcs.usda.gov). The third horizon from SDM was excluded because it is bedrock. |
|
Horizon Thickness (THKNS) |
10 cm (HORIZN = 1) 15 cm (HORIZN = 2)
|
NRCS Soil Data Mart (SDM) (http://soildatamart.nrcs.usda.gov). |
|
Bulk Density (BD) |
1.55 g/cm3 (HORIZN = 1) 1.55 g/cm3 (HORIZN = 2)
|
NRCS Soil Data Mart (SDM) (http://soildatamart.nrcs.usda.gov). Midpoint of the reported range. PRZM Scenario Guidance (EPA, 2004). |
|
Initial Water Content (THETO) |
0.168 cm3/cm3 (HORIZN =1) 0.168 cm3/cm3 (HORIZN =2)
|
NRCS Soil Data Mart (SDM); values are mean 1/3-bar water contents of Cieneba coarse sandy loam soils. |
|
Compartment Thickness (DPN) |
0.1 cm (HORIZN = 1) 5 cm (HORIZN = 2)
|
NRCS Soil Data Mart (SDM) (http://soildatamart.nrcs.usda.gov). PRZM Scenario Guidance (EPA, 2004). |
|
Field Capacity (THEFC) |
0.168 cm3/cm3 (HORIZN =1) 0.168 cm3/cm3 (HORIZN =2) |
NRCS Soil Data Mart (SDM); values are mean 1/3-bar water contents of Cieneba coarse sandy loam soils. |
|
Wilting Point (THEWP) |
0.08 cm3/cm3 (HORIZN =1) 0.08 cm3/cm3 (HORIZN =2) |
NRCS Soil Data Mart (SDM); values are mean 15-bar water contents of Cieneba coarse sandy loam soils. |
|
Organic Carbon Content (OC) |
0.44% (HORIZN = 1) 0.44% (HORIZN = 2)
|
NRCS SDM; values for horizons 1 to 3 = mean %OM / 1.724. PRZM Scenario Guidance (EPA, 2004). |
Figure 1. 2002 harvested acres for avocados based on USDA Census of Agriculture for California and conterminous United States (inset) Estimates do not include data for individual farms which NASS has excluded to protect the identify of individual farms.
|
Table 5. Avocado Bearing Soils of San Diego, Santa Barbara, and Ventura Counties (California) Ranked by Area. |
||||||||||||
|
Soil |
Total Acreage |
% Area |
Drainage |
Avocados-IrrYield (boxes) |
Erodibility |
Slopes (%) |
pH |
OM (%) |
% Sand |
% Silt |
% Clay |
Avocados-NIrrYield (boxes) |
|
332,986 |
37.12% |
C |
250-400 |
0.24-0.32 |
9-75 |
5.8-6.5 |
0.75 |
67.9-68.5 |
19-19.6 |
12.5 |
- |
|
|
74,863 |
8.35% |
B |
500-615 |
0.28-0.32 |
15-65 |
6.7 |
0.75 |
65.4-66.8 |
22.2-23.6 |
11 |
- |
|
|
62,334 |
6.95% |
D |
250 |
0.28-0.55 |
5-75 |
6.3-7.6 |
0.75 |
66.1-66.8 |
19.2-19.9 |
14 |
- |
|
|
57,147 |
6.37% |
-- |
375 |
- |
9-75 |
- |
0 |
- |
- |
- |
- |
|
|
49,991 |
5.57% |
D |
200 |
0.28 |
15-75 |
5.3-5.8 |
0.75-1.5 |
43-68.8 |
16.2-39.5 |
15-17.5 |
- |
|
|
38,078 |
4.25% |
A |
325-825 |
0.17-0.28 |
5-75 |
5.6-6.7 |
0.75 |
78.5-96 |
1.5-16.5 |
2.5-5 |
- |
|
|
34,528 |
3.85% |
B |
1000 |
0.17-0.28 |
0-9 |
8.2 |
3 |
18.1-68.8 |
16.2-50.9 |
15-31 |
- |
|
|
34,451 |
3.84% |
D |
150 |
0.2 |
30-70 |
6.3 |
1.5 |
66.1 |
19.9 |
14 |
- |
|
|
26,767 |
2.98% |
C |
250 |
0.2-0.32 |
30-75 |
8.2 |
2-3.5 |
18.1-35.4 |
33.6-50.9 |
31 |
- |
|
|
25,075 |
2.80% |
B |
300 |
0.17-0.2 |
9-50 |
7.2-7.6 |
2.5 |
35.4 |
33.6 |
31 |
- |
|
|
21,924 |
2.44% |
A |
300-330 |
0.15-0.28 |
0-15 |
5.8-6.7 |
0.75 |
80.5-96 |
1.5-17 |
2.5 |
- |
|
|
21,084 |
2.35% |
C |
250 |
0.17-0.28 |
30-50 |
6.1-6.1 |
2.5-3 |
35.4 |
33.6 |
31 |
- |
|
|
18,581 |
2.07% |
B |
400 |
0.2-0.28 |
0-15 |
6.5 |
3-4 |
34.2-41.6 |
33.6-37.4 |
21-31 |
- |
|
|
11,550 |
1.29% |
C |
325-1000 |
0.28-0.32 |
9-50 |
8.2 |
2-3 |
18.1 |
50.9 |
31 |
- |
|
|
10,936 |
1.22% |
B |
325-350 |
0.24-0.28 |
9-45 |
5.8-6.5 |
2.5 |
70.5 |
16.5 |
13 |
- |
|
|
10,843 |
1.21% |
B |
450-470 |
0.24 |
0-9 |
5.8 |
0.75 |
96 |
1.5 |
2.5 |
- |
|
|
9,622 |
1.07% |
B |
400 |
0.2 |
0-9 |
8.2 |
2.5 |
65.1 |
18.9 |
16 |
- |
|
|
9,036 |
1.01% |
B |
800-900 |
0.28 |
0-15 |
5.6-6.1 |
2 |
68.8 |
16.2 |
15 |
- |
|
|
8,355 |
0.93% |
B |
900 |
0.28 |
0-9 |
7.2 |
2 |
67.9 |
19.6 |
12.5 |
- |
|
|
6,803 |
0.76% |
D |
200 |
0.2 |
30-75 |
7.7-8.2 |
2 |
26.1 |
28.9 |
45 |
- |
|
|
6,670 |
0.74% |
D |
250-900 |
0.24 |
9-50 |
6.3 |
3 |
35.4 |
33.6 |
31 |
- |
|
|
5,652 |
0.63% |
B |
1000 |
0.24-0.28 |
0-9 |
7.2-7.5 |
3 |
45.4-70.5 |
16.5-41.6 |
13 |
- |
|
|
4,520 |
0.50% |
-- |
375 |
- |
15-50 |
- |
0 |
- |
- |
- |
- |
|
|
3,626 |
0.40% |
D |
300 |
0.37 |
15-50 |
6.1-6.7 |
1.5 |
68.8 |
16.2 |
15 |
- |
|
|
2,658 |
0.30% |
C |
250 |
0.24-0.43 |
0-2 |
8.2 |
2.5 |
18.1-66.8 |
19.2-50.9 |
14-31 |
- |
|
|
2,458 |
0.27% |
D |
200 |
0.2-0.24 |
30-50 |
7.3-7.5 |
2.5 |
22.1-23.3 |
27.9-29.2 |
47.5-50 |
- |
|
|
1,254 |
0.14% |
B |
325 |
0.28 |
2-9 |
6.1 |
1.5 |
68.8 |
16.2 |
15 |
- |
|
|
1,177 |
0.13% |
B |
325 |
0.28 |
9-15 |
6.7 |
0.75 |
67.2 |
15.3 |
17.5 |
- |
|
|
1,039 |
0.12% |
B |
375 |
- |
50-75 |
- |
- |
- |
- |
- |
- |
|
|
903 |
0.10% |
C |
500 |
0.32 |
0-2 |
8.2 |
2.5 |
68.1 |
14.4 |
17.5 |
- |
|
|
808 |
0.09% |
B |
1000 |
0.15-0.17 |
2-15 |
5.8 |
2.5 |
18.1-35.4 |
33.6-50.9 |
31 |
- |
|
|
629 |
0.07% |
-- |
375 |
- |
75-99 |
- |
- |
- |
- |
- |
- |
|
|
616 |
0.07% |
D |
300 |
0.37 |
30-50 |
5.8 |
1.5 |
67.5 |
21 |
11.5 |
- |
|
Works Cited
EPA. 1998. Carsel, R.F., J.C. Imhoff, P.R. Hummel, J.M. Cheplick, and A.S. Donigian, Jr. PRZM-3, A Model for Predicting Pesticide and Nitrogen Fate in the Crop Root and Unsaturated Soil Zones: Users Manual for Release 3.0. National Exposure Research Laboratory, Office of Research and Development, U.S. Environmental Protection Agency, Athens, GA.
EPA. 1999. Jones, R.D., J. Breithaupt, J. Carleton, L. Libelo, J. Lin, R. Matzner, and R. Parker. Guidance for Use of the Index Reservoir in Drinking Water Exposure Assessments. Environmental Fate and Effects Division, Office of Pesticide Programs, U.S. Environmental Protection Agency, Washington, DC.
EPA. 2004. Abel, S.A. Procedure for Conducting Quality Assurance and Quality Control of Existing and New PRZM Field and Orchard Crop Standard Scenarios. Environmental Fate and Effects Division, Office of Pesticide Programs, U.S. Environmental Protection Agency, Washington, DC.
EPA. 2005. Irrigation Guidance for developing PRZM Scenarios. June 15, 2005.
Oster JD, Arpaia ML. 2006. Effects of salinity and applied water on yields of 'Hass' avocado on Mexican seedling rootstock. Seminario: Manejo del riego y suelo en el cultivo del palto. 27-28 de Septiembre de 2006. 14 pages.
USDA. 1990. Davis, F.M., R.A. Leonard, W.G. Knisel. GLEAMS User Manual, Version 1.8.55. U.S. Department of Agriculture, Agricultural Research Service (ARS), Southeast Watershed Research Laboratory, Tifton, GA. SEWRL-030190FMD.
USDA. 1999a. Crop Profile for Avocados in California. U.S. Department of Agriculture, Pest Management Centers. July 1999. Online at: http://www.ipmcenters.org/cropprofiles/caavocados.html
USDA. 1999b. Official Series Description – CIENEBA Series. U.S. Department of Agriculture, Natural Resources Conservation Service (NRCS). May 1999. Online at: http://ortho.ftw.nrcs.usda.gov/osd/dat/C/CIENEBA.html.
USDA. 2000. Revised Universal Soil Loss Equation (RUSLE) EPA Pesticide Project. U.S. Department of Agriculture, National Resources Conservation Service (NRCS) and Agricultural Research Service (ARS).
USDA. 2002. 2002 Census of Agriculture. U.S. Department of Agriculture, National Agricultural Statistics Service (NASS). Online at: http://www.nass.usda.gov/census/census02/preliminary/2002censusdates.htm.
USDA. 2006. Soil Survey Areas of San Diego, Santa Barbara, and Ventura Counties. U.S. Department of Agriculture, Natural Resources Conservation Service (NRCS), Soil Data Mart. March 1, 2006. Online at: http://soildatamart.nrcs.usda.gov.