
Sunshine Properties Blog
Subscribe and receive email notifications of new blog posts.
 RSS Feed
- 2026 | 62 Posts
- 2025 | 133 Posts
- 2024 | 168 Posts
- 2023 | 105 Posts
- 2022 | 144 Posts
- 2020 | 12 Posts
- 2019 | 44 Posts
- 2018 | 106 Posts
- 2017 | 80 Posts
30
Southern California home prices rise 7%, though some say the market is slowing
Southern California home prices kept rising in August, but sales fell as questions grow over whether the torrid housing market is finally cooling.
The median sales price in the six-county region rose to $535,000, up 1% from July, research firm CoreLogic said Wednesday. The median — the point at which half the homes sold for more and half for less — was up 7% from a year earlier and just shy of the all-time high of $537,000 reached in June.
20
C.A.R. releases its 2019 California Housing Market Forecast
C.A.R. releases its 2019 California Housing Market Forecast
Market shift underway as housing shortage issue becomes demand issue
LOS ANGELES (Oct. 11) – A combination of high home prices and eroding affordability is expected to cut into housing demand and contribute to a weaker housing market in 2019, and 2018 home sales will register lower for the first time in four years, according to a housing and economic forecast released today by the CALIFORNIA ASSOCIATION OF REALTORS®' (C.A.R.).
C.A.R.'s "2019 California Housing Market Forecast" sees a modest decline in existing single-family home sales of 3.3 percent next year to reach 396,800 units, down from the projected 2018 sales figure of 410,460. The 2018 figure is 3.2 percent lower compared with the 424,100 pace of homes sold in 2017.
"While home prices are predicted to temper next year, interest rates will likely rise and compound housing affordability issues," said C.A.R. President Steve White. "Would-be buyers who are concerned that home prices may have peaked will wait on the sidelines until they have more clarity on where the housing market is headed. This could hold back housing demand and hamper home sales in 2019."
C.A.R.'s forecast projects growth in the U.S. Gross Domestic Product of 2.4 percent in 2019, after a projected gain of 3.0 percent in 2018. With California's nonfarm job growth at 1.4 percent, down from a projected 2.0 percent in 2018, the state's unemployment rate will remain at 4.3 percent in 2019, unchanged from 2018's figure but down from and 4.8 percent in 2017.
The average for 30-year, fixed mortgage interest rates will rise to 5.2 percent in 2019, up from 4.7 percent in 2018 and 4.0 percent in 2017, but will still remain low by historical standards.
The California median home price is forecast to increase 3.1 percent to $593,450 in 2019, following a projected 7.0 percent increase in 2018 to $575,800.
"The surge in home prices over the past few years due to the housing supply shortage has finally taken a toll on the market," said C.A.R. Senior Vice President and Chief Economist Leslie Appleton-Young. "Despite an improvement in supply conditions, there is a high level of uncertainty about the direction of the market that is affecting homebuying decisions. This psychological effect is creating a mismatch in price expectations between buyers and sellers and will limit price growth in the upcoming year."
Outmigration, which is a result of the state's housing affordability issue, will also be a primary concern for the California housing market in 2019 as interest rates are expected to rise further next year. The high housing cost is driving Californians to leave their current county or even the state. According to C.A.R.'s 2018 State of the Housing Market/Study of Housing: Insight, Forecast, Trends (SHIFT) report, 28 percent of homebuyers moved out of the county in which they previously resided, up from 21 percent in 2017. The outmigration trend was even worse in the Bay Area, where housing was the least affordable, with 35 percent of homebuyers moving out because of affordability constraints. Southern California did not fare any better as 35 percent of homebuyers moved out of their county for the same reason, a significant jump from 21 percent in 2017. The substantial surge in homebuyers fleeing the state is reflected by the home sales decline in Southern California, which was down on a year-over-year basis for the first eight months of 2018. Outmigration will not abate as long as home prices are out of reach and interest rates rise in the upcoming year.
2019 CALIFORNIA HOUSING FORECAST
p = projected * = % of households who can afford median-priced home |
Leading the way ...® in real estate news and information for more than 110 years, the CALIFORNIA ASSOCIATION OF REALTORS® (www.car.org) is one of the largest state trade organizations in the United States, with more than 190,000 members dedicated to the advancement of professionalism in real estate. C.A.R. is headquartered in Los Angeles.
20
HOLIDAY Shopping easy send organic fruit!!!
HOLIDAY Shopping easy, SEND organic fruit!!!
Variety Packs
We offer 4 different subscription: 1-month, 3-months, 6-months & 12-months. A year's subscription allows you to enjoy all 16 of our varieties, where you can keep track of their different tastes, & textures each offer. Some varieties only produce every other year and even some that only set and produce every 3rd year. (this being why they are not commercially viable)
The Hass consistently set an average crop every year. It has a very long marketing season from January thru September and it handles perfectly not bruising and storing in cold storage safely for up to 20+ days. Because we pick-pack and ship the same day your fruit will arrive in excellent condition and able to store and eat at your own pace.
*Bonus we will include one bottle of our Honey for any 12-month order for free.
20
Visual and Financial Impact: Bathroom Remodels that Drive Value
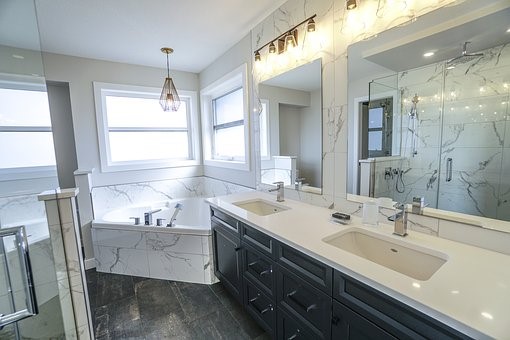
Visual and Financial Impact: Bathroom Remodels that Drive Value
An average bathroom remodel costs around $10,000. However, it's possible to budget a remodel, with plenty of return on investment, for as little as $3,500. In fact, a bathroom remodel can produce some of the highest home-resale value, making it an especially popular place to upgrade among those looking to put their house on the market. If this sounds like you, start listing the alterations and improvements you want to make, pricing them, and talking with contractors (unless you plan to make this DIY project). Once you have the basics mapped out, you will be able to use the following tips to ensure your bathroom remodel upgrades drive the most value possible.
Budgeting
If your aim is to focus on budget items that make a real difference in your bathroo...
8
Third quarter housing affordability
Third quarter housing affordability
- Twenty-seven percent of California households could afford to purchase the $588,530 median-priced home in the third quarter of 2018, up from 26 percent in second-quarter 2018 and down from 28 percent a year ago.
- A minimum annual income of $125,540 was needed to make monthly payments of $3,140, including principal, interest, and taxes on a 30-year fixed-rate mortgage at a 4.77 percent interest rate.
- Thirty-five percent of home buyers were able to purchase the $479,390 median-priced condo or townhome. An annual income of $102,260 was required to make a monthly payment of $2,560.
LOS ANGELES (Nov. 1) – More Californians could afford to purchase a home in the third quarter as flat home prices and stable interest rates combined to improve California housing affordability, the CALIFORNIA ASSOCIATION OF REALTORS® (C.A.R.) said today.
The percentage of home buyers who could afford to purchase a median-priced, existing single-family home in California in third-quarter 2018 edged up to 27 percent from 26 percent in the second quarter of 2018 and was down from 28 percent in the third quarter a year ago, according to C.A.R.'s Traditional Housing Affordability Index (HAI). The index has been below 30 percent for five of the past eight quarters. California's housing affordability index hit a peak of 56 percent in the first quarter of 2012.
C.A.R.'s HAI measures the percentage of all households that can afford to purchase a median-priced, single-family home in California. C.A.R. also reports affordability indices for regions and select counties within the state. The index is considered the most fundamental measure of housing well-being for home buyers in the state.
A minimum annual income of $125,540 was needed to qualify for the purchase of a $588,530 statewide median-priced, existing single-family home in the third quarter of 2018. The monthly payment, including taxes and insurance on a 30-year, fixed-rate loan, would be $3,140, assuming a 20 percent down payment and an effective composite interest rate of 4.77 percent. The effective composite interest rate in second-quarter 2018 was 4.7 percent and 4.16 percent in the third quarter of 2017.
Conversely, housing affordability for condominiums and townhomes fell in third-quarter 2018 compared to the previous quarter with 35 percent of California households earning the minimum income to qualify for the purchase of a $479,390 median-priced condominium/townhome, down from 36 percent in the second quarter. An annual income of $102,260 was required to make monthly payments of $2,560.
Compared with California, more than half of the nation's households (53 percent) could afford to purchase a $266,900 median-priced home, which required a minimum annual income of $56,930 to make monthly payments of $1,420.
Key points from the third-quarter 2018 Housing Affordability report include:
- Housing affordability improved from third-quarter 2017 in 10 tracked counties and declined in 33 counties. Affordability in five counties remained flat.
- In the San Francisco Bay Area, affordability improved from a year ago in San Francisco and Marin counties, primarily due to higher wages. Affordability fell in six counties (Alameda, Contra Costa, Napa, San Mateo, Solano, and Sonoma). Affordability held steady in Santa Clara County.
- In Southern California, affordability improved only in Ventura, and dropped in four counties (Orange, Riverside, San Bernardino, and San Diego) compared to a year ago. Affordability in Los Angeles County was unchanged.
- In the Central Valley, Fresno and Madera counties saw an improvement in affordability from third-quarter 2017. Housing affordability decreased from a year ago in eight counties (Kings, Merced, Placer, Sacramento, San Benito, San Joaquin, Stanislaus and Tulare). Affordability held steady only in Kern County.
- In the Central Coast region, only Santa Barbara experienced a year-to-year improvement in affordability, while three counties (Monterey, San Luis Obispo, and Santa Cruz) posted a decline.
- During the third quarter of 2018, the most affordable counties in California were Lassen (67 percent), Kern and Kings (51 percent), Tehama (49 percent) and Yuba (48 percent).
- Mono (11 percent), Santa Cruz (12 percent), San Mateo (14 percent), San Francisco (15 percent), and Santa Clara (17 percent) counties were the least affordable areas in the state.
Housing Affordability slides (click link to open)
Affordability peak versus current
Annual required income peak vs. current
Monthly PITI peak versus current
Affordability by region peak versus current
Housing affordability by county
See C.A.R.'s historical housing affordability data.
See second-time buyer housing affordability data.
Leading the way…® in California real estate for more than 110 years, the CALIFORNIA ASSOCIATION OF REALTORS® (www.car.org) is one of the largest state trade organizations in the United States with more than190,000 members dedicated to the advancement of professionalism in real estate. C.A.R. is headquartered in Los Angeles.
# # #
CALIFORNIA ASSOCIATION OF REALTORS®
Traditional Housing Affordability Index
Third quarter 2018
|
STATE/REGION/COUNTY |
3rd Qtr 2018 |
2nd Qtr 2018 |
|
3rd Qtr 2017 |
|
Median Home Price |
Monthly Payment Including Taxes & Insurance |
Minimum Qualifying Income |
|
Calif. Single-family home |
27 |
26 |
|
28 |
|
$588,530 |
$3,140 |
$125,540 |
|
Calif. Condo/Townhome |
35 |
36 |
|
38 |
|
$479,390 |
$2,560 |
$102,260 |
|
Los Angeles Metro Area |
30 |
29 |
|
30 |
|
$526,000 |
$2,810 |
$112,200 |
|
Inland Empire |
41 |
41 |
|
43 |
|
$362,500 |
$1,930 |
$77,330 |
|
San Francisco Bay Area |
21 |
18 |
|
23 |
|
$950,000 |
$5,070 |
$202,650 |
|
United States |
53 |
53 |
|
55 |
|
$266,900 |
$1,420 |
$56,930 |
|
|
|
|
|
|
|
|
|
|
|
San Francisco Bay Area |
|
|
|
|
|
|
|
|
|
Alameda |
18 |
16 |
|
20 |
|
$950,000 |
$5,070 |
$202,650 |
|
Contra Costa |
32 |
29 |
|
33 |
|
$660,000 |
$3,520 |
$140,790 |
|
Marin |
19 |
18 |
|
18 |
|
$1,300,000 |
$6,930 |
$277,310 |
|
Napa |
24 |
25 |
|
26 |
|
$729,500 |
$3,890 |
$155,610 |
|
San Francisco |
15 |
14 |
|
13 |
|
$1,600,000 |
$8,530 |
$341,300 |
|
San Mateo |
14 |
14 |
|
15 |
|
$1,600,000 |
$8,530 |
$341,300 |
|
Santa Clara |
17 |
16 |
|
17 |
|
$1,300,000 |
$6,930 |
$277,310 |
|
Solano |
38 |
38 |
|
43 |
|
$455,000 |
$2,430 |
$97,060 |
|
Sonoma |
22 |
20 |
|
25 |
|
$660,000 |
$3,520 |
$140,790 |
|
Southern California |
|
|
|
|
|
|
|
|
|
Los Angeles |
22 |
26 |
|
22 |
|
$628,940 |
$3,350 |
$134,160 |
|
Orange |
20 |
20 |
|
21 |
|
$830,000 |
$4,430 |
$177,050 |
|
Riverside |
37 |
37 |
|
38 |
|
$405,000 |
$2,160 |
$86,390 |
|
San Bernardino |
48 |
49 |
|
51 |
|
$294,900 |
$1,570 |
$62,910 |
|
San Diego |
23 |
23 |
|
26 |
|
$650,000 |
$3,470 |
$138,650 |
|
Ventura |
28 |
28 |
|
27 |
|
$665,000 |
$3,550 |
$141,850 |
|
Central Coast |
|
|
|
|
|
|
|
|
|
Monterey |
20 |
19 |
|
22 |
|
$622,000 |
$3,320 |
$132,680 |
|
San Luis Obispo |
21 |
22 |
|
23 |
|
$640,000 |
$3,410 |
$136,520 |
|
Santa Barbara |
26 |
20 |
|
20 |
|
$599,500 |
$3,200 |
$127,880 |
|
Santa Cruz |
12 |
12 |
|
17 |
|
$903,000 |
$4,820 |
$192,620 |
|
Central Valley |
|
|
|
|
|
|
|
|
|
Fresno |
46 |
46 |
r |
45 |
|
$275,060 |
$1,470 |
$58,670 |
|
Kern |
53 |
53 |
|
53 |
|
$246,000 |
$1,310 |
$52,480 |
|
Kings |
51 |
50 |
|
52 |
|
$230,000 |
$1,230 |
$49,060 |
|
Madera |
48 |
48 |
r |
44 |
|
$260,000 |
$1,390 |
$55,460 |
|
Merced |
40 |
42 |
|
47 |
|
$276,320 |
$1,470 |
$58,940 |
|
Placer |
42 |
41 |
|
44 |
|
$480,000 |
$2,560 |
$102,390 |
|
Sacramento |
42 |
41 |
|
43 |
|
$370,000 |
$1,970 |
$78,930 |
|
San Benito |
27 |
30 |
|
31 |
|
$610,000 |
$3,250 |
$130,120 |
|
San Joaquin |
38 |
38 |
|
41 |
|
$370,000 |
$1,970 |
$78,930 |
|
Stanislaus |
45 |
45 |
|
46 |
|
$319,900 |
$1,710 |
$68,240 |
|
Tulare |
47 |
48 |
|
51 |
|
$239,900 |
$1,280 |
$51,170 |
|
Other Calif. Counties |
|
|
|
|
|
|
|
|
|
Amador |
NA |
44 |
|
44 |
|
NA |
NA |
NA |
|
Butte |
39 |
38 |
|
40 |
|
$315,000 |
$1,680 |
$67,190 |
|
Calaveras |
43 |
43 |
|
44 |
|
$332,950 |
$1,780 |
$71,020 |
|
El Dorado |
41 |
38 |
|
41 |
|
$489,500 |
$2,610 |
$104,420 |
|
Humboldt |
33 |
33 |
|
33 |
|
$315,000 |
$1,680 |
$67,190 |
|
Lake County |
39 |
37 |
|
38 |
|
$266,250 |
$1,420 |
$56,790 |
|
Lassen |
67 |
64 |
|
64 |
|
$175,000 |
$930 |
$37,330 |
|
Mariposa |
40 |
39 |
|
51 |
|
$315,000 |
$1,680 |
$67,190 |
|
Mendocino |
23 |
22 |
|
28 |
|
$420,000 |
$2,240 |
$89,590 |
|
Mono |
11 |
14 |
|
20 |
|
$675,000 |
$3,600 |
$143,990 |
|
Nevada |
32 |
32 |
|
39 |
|
$429,500 |
$2,290 |
$91,620 |
|
Plumas |
44 |
42 |
|
47 |
|
$282,000 |
$1,500 |
$60,150 |
|
Shasta |
44 |
46 |
|
48 |
|
$275,000 |
$1,470 |
$58,660 |
|
Siskiyou |
47 |
48 |
|
49 |
|
$214,200 |
$1,140 |
$45,690 |
|
Sutter |
45 |
45 |
|
51 |
|
$298,500 |
$1,590 |
$63,670 |
|
Tehama |
49 |
51 |
|
56 |
|
$223,950 |
$1,190 |
$47,770 |
|
Tuolumne |
41 |
43 |
|
45 |
|
$318,000 |
$1,700 |
$67,830 |
|
Yolo |
35 |
33 |
|
34 |
|
$450,000 |
$2,400 |
$95,990 |
|
Yuba |
48 |
45 |
|
43 |
|
$270,000 |
$1,440 |
$57,590 |
r = revised
NA = Not available