
Sunshine Properties Blog
Sunshine Properties Blog
 RSS Feed
Subscribe and receive email notifications of new blog posts.
RSS Feed
- 2026 | 62 Posts
- 2025 | 133 Posts
- 2024 | 168 Posts
- 2023 | 105 Posts
- 2022 | 144 Posts
- 2020 | 12 Posts
- 2019 | 44 Posts
- 2018 | 106 Posts
- 2017 | 80 Posts
Uncategorized | 854 Posts
April
19
19
March home sales and price report
April 16, 2019
|
California home sales, median price moderate in March, C.A.R. reports |
|
|
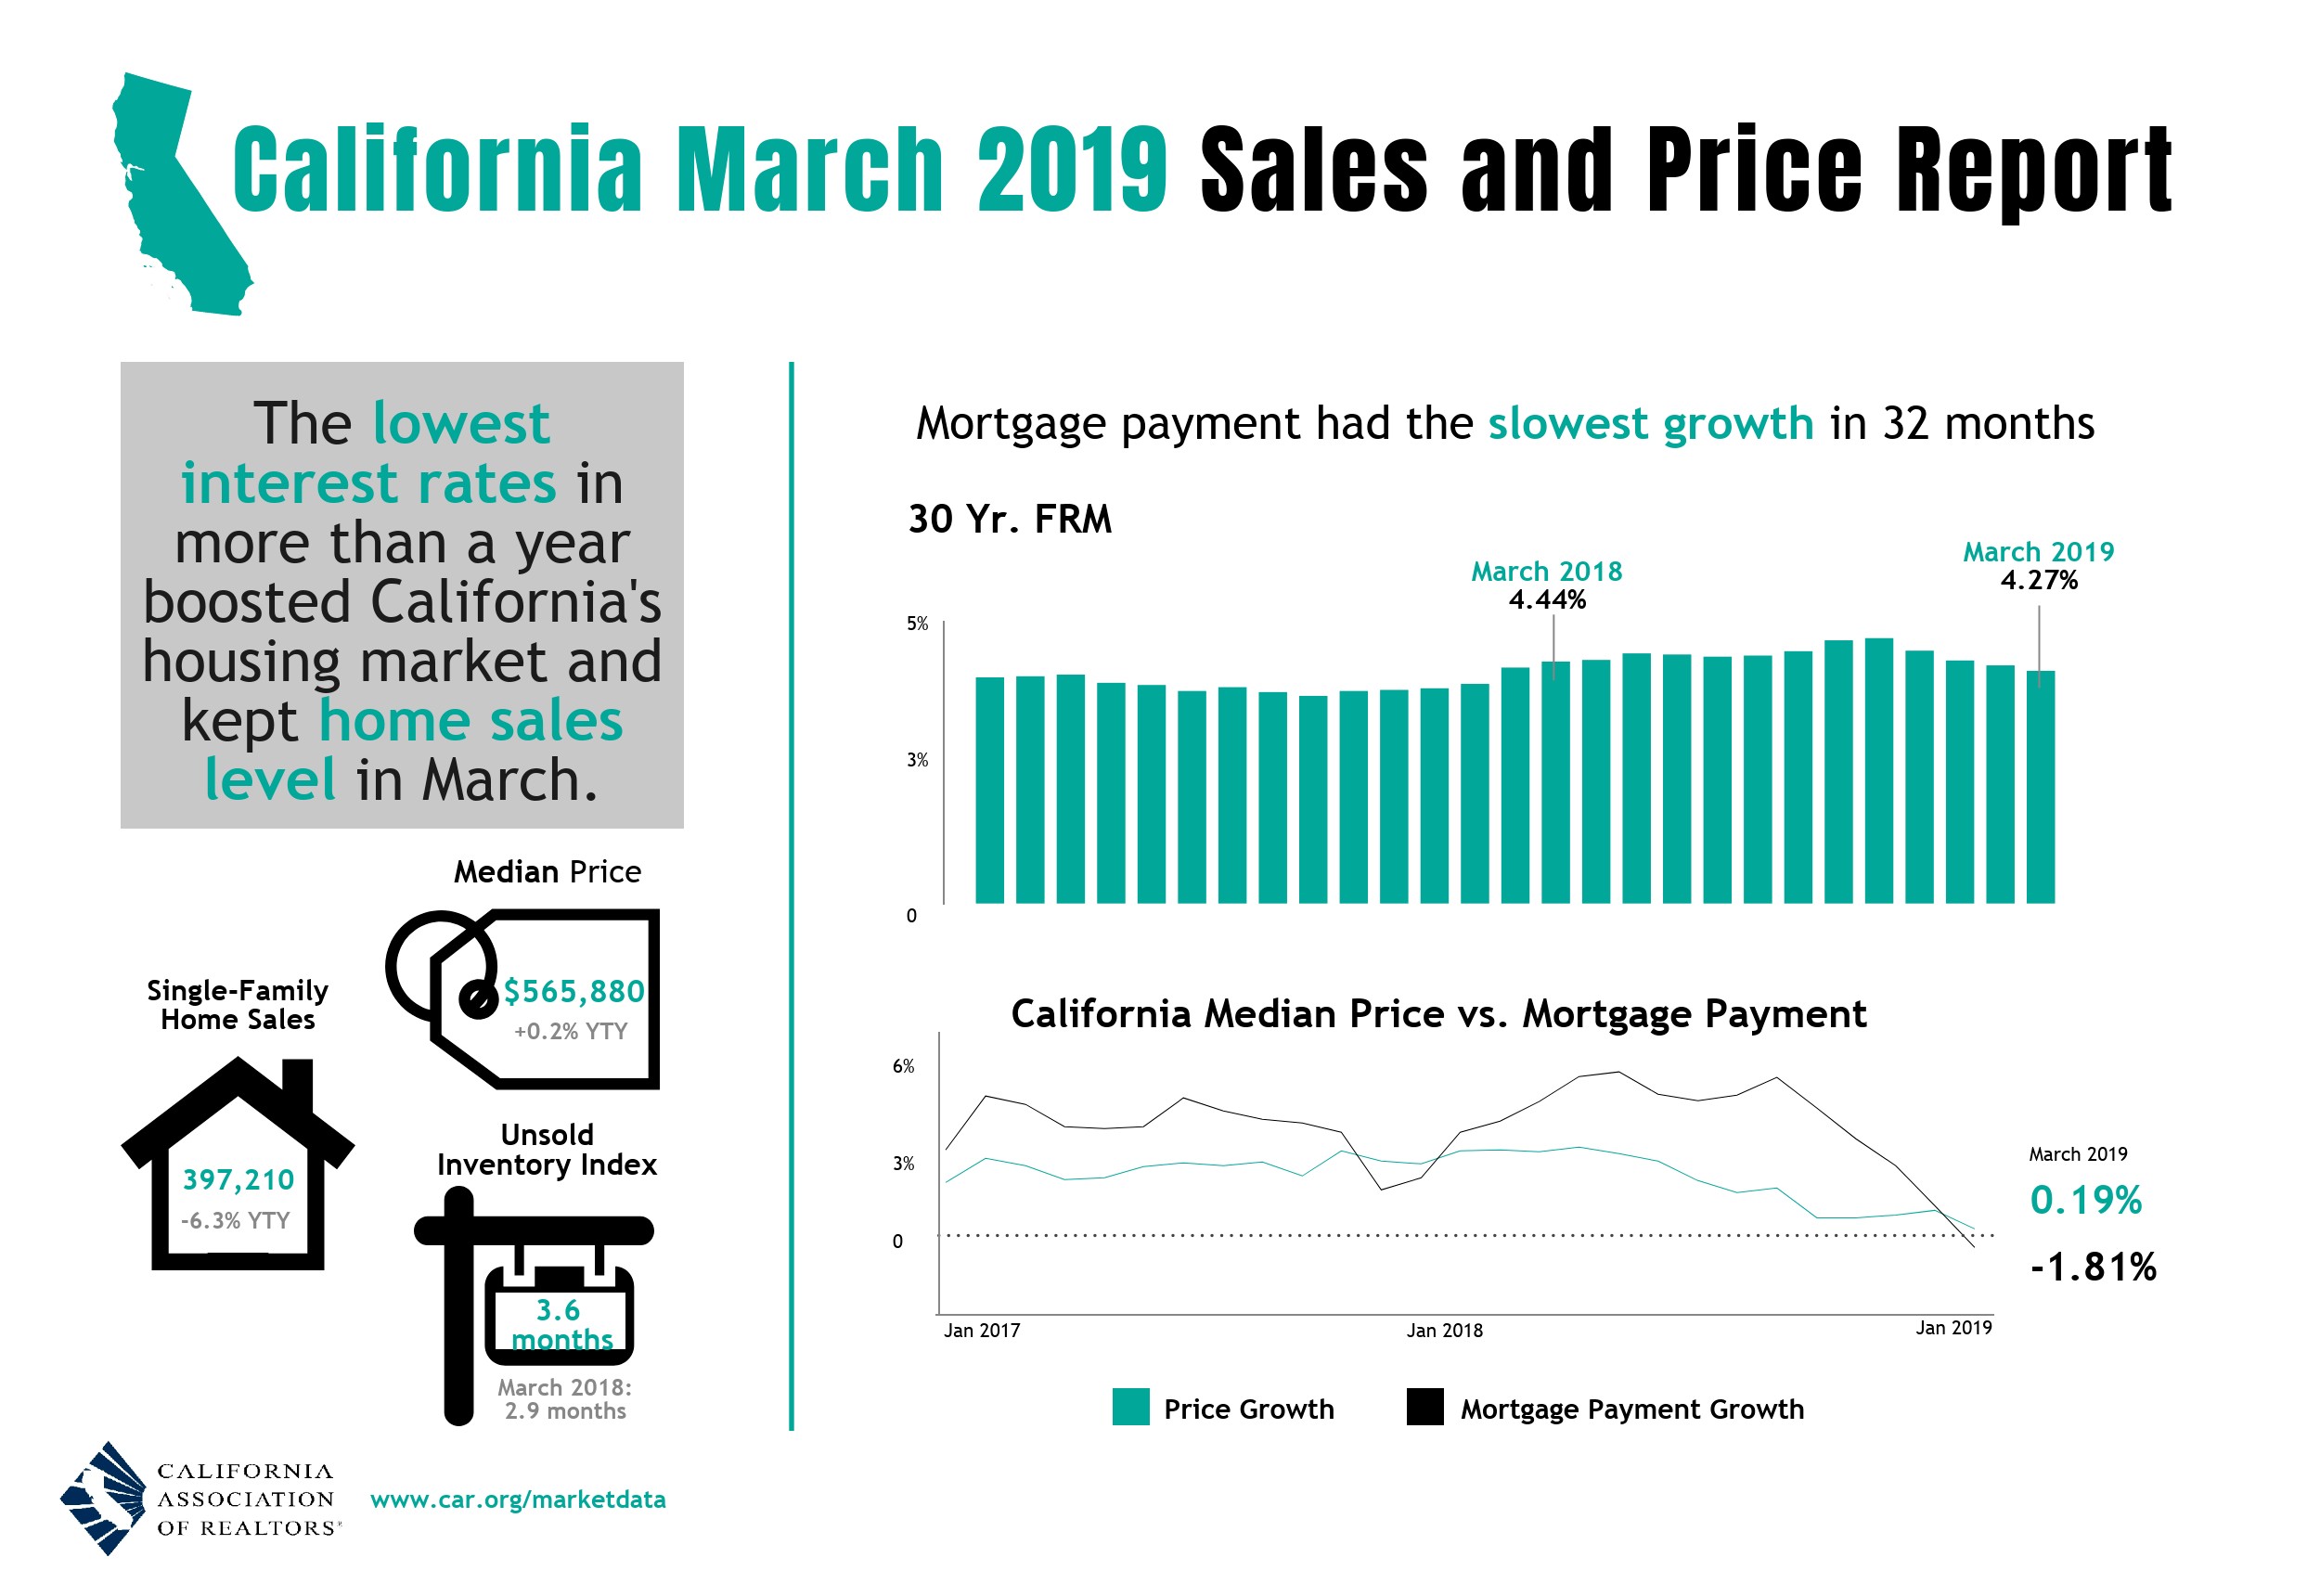
- Existing, single-family home sales totaled 397,210 in March on a seasonally adjusted annualized rate, down 0.2 percent from February and down 6.3 percent from March 2018. - March's statewide median home price was $565,880, down 5.9 percent from February and up 0.2 percent from March 2018. - The Unsold Inventory Index was 3.6 months in March, down from 4.6 months in February but up from 2.9 months in March 2018. - Year-to-date sales were down 8.2 percent in March. |
 click to view |
LOS ANGELES (April 16) – The lowest interest rates in more than a year boosted California's housing market and kept home sales level in March after an exceptionally strong performance the previous month, the CALIFORNIA ASSOCIATION OF REALTORS® (C.A.R.) said today.
Closed escrow sales of existing, single-family detached homes in California totaled a seasonally adjusted annualized rate of 397,210 units in March, according to information collected by C.A.R. from more than 90 local REALTOR® associations and MLSs statewide. The statewide annualized sales figure represents what would be the total number of homes sold during 2019 if sales maintained the March pace throughout the year. It is adjusted to account for seasonal factors that typically influence home sales.
March's sales figure was down 0.2 percent from the revised 398,040 level in February and down 6.3 percent from home sales in March 2018 of 423,990.
"The lowest interest rates in more than a year gave would-be buyers the confidence to enter the housing market and provided a much-needed push to jump-start the spring homebuying season," said C.A.R. President Jared Martin. "Pending sales also showed healthy improvement in March, which suggests a brighter market outlook could be in place in the second quarter."
After hitting the lowest level in 12 months in February 2019, the statewide median home price bounced back and reached the highest point since October 2018. The statewide median home price rose 5.9 percent to $565,880 in March from $534,140 in February and was up 0.2 percent from a revised $564,820 in March 2018.
"The median price has been softening since it reached a peak last summer, and March's year-over-year price increase was the smallest in seven years," said C.A.R. Senior Vice President and Chief Economist Leslie Appleton-Young. "The flattening home prices, coupled with low mortgage rates, bode well for housing affordability and may bring more buyers who may have given up back to the market."
Other key points from C.A.R.'s March 2019 resale housing report include:
- Sales dropped on a non-seasonally adjusted annual basis in all major regions, with double-digit sales declines in the Los Angeles Metro, Inland Empire regions and San Francisco Bay Area while the Central Coast and Central Valley regions experienced single-digit declines.
- Non-seasonally adjusted sales in the San Francisco Bay Area were down 10.8 percent from March 2018. Home sales in all of the nine Bay Area counties fell from a year ago, especially in Napa and Sonoma counties, which suffered the largest decreases.
- The Los Angeles Metro region posted a non-seasonally adjusted year-over-year sales drop of 12 percent, with home sales falling in every county. Ventura had the biggest decline in sales, while San Diego dropped the least.
- Home sales in the Inland Empire declined 10.4 percent from a year ago as Riverside and San Bernardino counties posted annual sales declines of 9.3 percent and 12.2 percent, respectively.
- At the regional level, the median home price increased in Southern California and the Central Valley region while dipping in the San Francisco Bay Area and the Central Coast regions. On a year-over-year basis, the Bay Area median price dipped 4.1 percent from March 2018. The decline was the largest year-over-year drop since January 2012 and the first back-to-back decrease since early 2012. Only Napa County recorded an annual price increase.
- In the Southern California region, home prices increased in San Bernardino, Riverside and Ventura while they declined in Los Angeles, Orange and San Diego counties.
- Active listings continued to climb from the prior year, increasing 13.4 percent from last March. It was the 12th consecutive month active listings rose year-over-year and the ninth month in a row they grew double digits from the prior year. The pace of increase, however, was the slowest since July 2018, and the growth rate has been decelerating since December 2018.
- The Unsold Inventory Index (UII), which is a ratio of inventory over sales, improved on a year-over-year basis but decreased on a month-to-month basis. The Unsold Inventory Index was 3.6 months in March, down from 4.6 months in February but up from 3.0 months in March 2018. The index measures the number of months it would take to sell the supply of homes on the market at the current sales rate. The jump in the UII from a year ago can be attributed to the moderate sales decline and the sharp increase in active listings.
- The median number of days it took to sell a California single-family home fell from 33 days in February to 25 days in March. It took a median number of 16 days to sell a home in March 2018.
- C.A.R.'s statewide sales-price-to-list-price ratio* was 98.5 percent in March 2019 compared to 100 percent in March 2018.
- The average statewide price per square foot** for an existing, single-family home statewide was $277 in March 2019 and $276 in March 2018.
- The 30-year, fixed-mortgage interest rate averaged 4.27 percent in March, down from 4.44 percent in March 2018, according to Freddie Mac. The five-year, adjustable mortgage interest rate also declined in March to an average of 3.83 percent from 3.65 in March 2018.
Note: The County MLS median price and sales data in the tables are generated from a survey of more than 90 associations of REALTORS® throughout the state and represent statistics of existing single-family detached homes only. County sales data are not adjusted to account for seasonal factors that can influence home sales. Movements in sales prices should not be interpreted as changes in the cost of a standard home. The median price is where half sold for more and half sold for less; medians are more typical than average prices, which are skewed by a relatively small share of transactions at either the lower-end or the upper-end. Median prices can be influenced by changes in cost, as well as changes in the characteristics and the size of homes sold. The change in median prices should not be construed as actual price changes in specific homes.
*Sales-to-list-price ratio is an indicator that reflects the negotiation power of home buyers and home sellers under current market conditions. The ratio is calculated by dividing the final sales price of a property by its last list price and is expressed as a percentage. A sales-to-list ratio with 100 percent or above suggests that the property sold for more than the list price, and a ratio below 100 percent indicates that the price sold below the asking price.
**Price per square foot is a measure commonly used by real estate agents and brokers to determine how much a square foot of space a buyer will pay for a property. It is calculated as the sale price of the home divided by the number of finished square feet. C.A.R. currently tracks price-per-square foot statistics for 50 counties.
Leading the way…® in California real estate for more than 110 years, the CALIFORNIA ASSOCIATION OF REALTORS® (www.car.org) is one of the largest state trade organizations in the United States with more than 200,000 members dedicated to the advancement of professionalism in real estate. C.A.R. is headquartered in Los Angeles.
# # #
March 2019 County Sales and Price Activity
(Regional and condo sales data not seasonally adjusted)
|
March 2019 |
Median Sold Price of Existing Single-Family Homes |
Sales |
|||||||
|
State/Region/County |
March 2019 |
Feb. 2019 |
|
March 2018 |
|
Price MTM% Chg |
Price YTY% Chg |
Sales MTM% Chg |
Sales YTY% Chg |
|
Calif. Single-family home |
$565,880 |
$534,140 |
|
$564,820 |
r |
5.9% |
0.2% |
-0.2% |
-6.3% |
|
Calif. Condo/Townhome |
$465,000 |
$450,000 |
|
$460,500 |
r |
3.3% |
1.0% |
33.6% |
-11.6% |
|
Los Angeles Metro Area |
$517,000 |
$505,000 |
|
$515,000 |
|
2.4% |
0.4% |
37.0% |
-12.0% |
|
Central Coast |
$645,000 |
$650,000 |
|
$660,000 |
|
-0.8% |
-2.3% |
45.7% |
-7.4% |
|
Central Valley |
$325,000 |
$320,000 |
|
$320,000 |
|
1.6% |
1.6% |
32.8% |
-8.2% |
|
Inland Empire |
$374,900 |
$369,900 |
|
$351,450 |
|
1.4% |
6.7% |
33.5% |
-10.4% |
|
San Francisco Bay Area |
$940,000 |
$867,000 |
|
$980,000 |
|
8.4% |
-4.1% |
46.1% |
-10.8% |
|
|
|
|
|
|
|
|
|
|
|
|
San Francisco Bay Area |
|
|
|
|
|
|
|
|
|
|
Alameda |
$911,000 |
$860,000 |
|
$955,000 |
|
5.9% |
-4.6% |
44.3% |
-7.0% |
|
Contra Costa |
$644,000 |
$649,480 |
r |
$655,000 |
|
-0.8% |
-1.7% |
56.8% |
-12.6% |
|
Marin |
$1,300,000 |
$1,290,000 |
|
$1,392,500 |
|
0.8% |
-6.6% |
40.0% |
-5.8% |
|
Napa |
$699,000 |
$625,000 |
|
$675,000 |
|
11.8% |
3.6% |
-3.0% |
-27.0% |
|
San Francisco |
$1,637,500 |
$1,505,000 |
|
$1,680,000 |
|
8.8% |
-2.5% |
54.5% |
-11.0% |
|
San Mateo |
$1,610,000 |
$1,425,000 |
|
$1,615,000 |
|
13.0% |
-0.3% |
46.0% |
-10.9% |
|
Santa Clara |
$1,300,000 |
$1,170,000 |
|
$1,454,500 |
|
11.1% |
-10.6% |
57.9% |
-11.2% |
|
Solano |
$438,500 |
$425,000 |
|
$445,000 |
|
3.2% |
-1.5% |
40.8% |
-3.3% |
|
Sonoma |
$633,750 |
$625,420 |
r |
$685,000 |
|
1.3% |
-7.5% |
19.1% |
-20.4% |
|
Southern California |
|
|
|
|
|
|
|
|
|
|
Los Angeles |
$525,520 |
$541,390 |
|
$528,980 |
|
-2.9% |
-0.7% |
36.3% |
-13.0% |
|
Orange |
$809,500 |
$792,500 |
|
$824,450 |
|
2.1% |
-1.8% |
52.0% |
-12.5% |
|
Riverside |
$412,000 |
$410,000 |
|
$398,000 |
|
0.5% |
3.5% |
32.7% |
-9.3% |
|
San Bernardino |
$309,950 |
$298,250 |
|
$280,000 |
|
3.9% |
10.7% |
35.1% |
-12.2% |
|
San Diego |
$623,800 |
$625,000 |
|
$625,400 |
|
-0.2% |
-0.3% |
34.1% |
-3.9% |
|
Ventura |
$640,000 |
$620,000 |
|
$638,500 |
|
3.2% |
0.2% |
24.0% |
-15.4% |
|
Central Coast |
|
|
|
|
|
|
|
|
|
|
Monterey |
$579,000 |
$593,950 |
|
$625,000 |
|
-2.5% |
-7.4% |
39.6% |
-13.7% |
|
San Luis Obispo |
$629,500 |
$592,500 |
|
$610,000 |
|
6.2% |
3.2% |
49.4% |
-11.0% |
|
Santa Barbara |
$555,000 |
$645,000 |
|
$698,000 |
r |
-14.0% |
-20.5% |
49.1% |
3.5% |
|
Santa Cruz |
$918,000 |
$927,000 |
|
$910,000 |
|
-1.0% |
0.9% |
43.0% |
-7.5% |
|
Central Valley |
|
|
|
|
|
|
|
|
|
|
Fresno |
$280,000 |
$265,000 |
|
$264,950 |
|
5.7% |
5.7% |
49.7% |
-12.5% |
|
Glenn |
$250,000 |
$281,000 |
|
$244,500 |
|
-11.0% |
2.2% |
58.8% |
68.8% |
|
Kern |
$249,950 |
$240,000 |
|
$232,500 |
|
4.1% |
7.5% |
42.2% |
-4.4% |
|
Kings |
$232,000 |
$221,000 |
|
$238,000 |
|
5.0% |
-2.5% |
21.1% |
-16.5% |
|
Madera |
$265,000 |
$259,000 |
|
$265,000 |
|
2.3% |
0.0% |
-15.0% |
-15.0% |
|
Merced |
$275,000 |
$269,000 |
|
$257,500 |
|
2.2% |
6.8% |
22.0% |
-19.6% |
|
Placer |
$475,000 |
$495,000 |
|
$475,500 |
|
-4.0% |
-0.1% |
28.2% |
-5.1% |
|
Sacramento |
$365,000 |
$360,000 |
|
$365,000 |
|
1.4% |
0.0% |
31.1% |
-5.4% |
|
San Benito |
$610,000 |
$600,000 |
|
$586,670 |
|
1.7% |
4.0% |
29.0% |
-27.3% |
|
San Joaquin |
$355,000 |
$370,000 |
|
$370,000 |
|
-4.1% |
-4.1% |
29.1% |
-16.1% |
|
Stanislaus |
$320,000 |
$310,000 |
|
$308,000 |
|
3.2% |
3.9% |
25.8% |
-8.8% |
|
Tulare |
$230,000 |
$243,500 |
|
$232,500 |
|
-5.5% |
-1.1% |
55.6% |
5.0% |
|
Other Calif. Counties |
|
|
|
|
|
|
|
|
|
|
Amador |
NA |
NA |
|
$340,000 |
|
NA |
NA |
NA |
NA |
|
Butte |
$369,000 |
$345,450 |
r |
$315,000 |
|
6.8% |
17.1% |
9.1% |
40.3% |
|
Calaveras |
$308,250 |
$340,000 |
|
$325,000 |
|
-9.3% |
-5.2% |
2.2% |
-7.1% |
|
Del Norte |
$253,025 |
$245,000 |
|
$200,000 |
|
3.3% |
26.5% |
-9.1% |
-47.4% |
|
El Dorado |
$506,165 |
$495,000 |
|
$510,000 |
|
2.3% |
-0.8% |
89.0% |
-12.7% |
|
Humboldt |
$310,000 |
$298,000 |
|
$313,500 |
|
4.0% |
-1.1% |
44.9% |
2.7% |
|
Lake |
$243,500 |
$260,000 |
|
$280,000 |
|
-6.3% |
-13.0% |
-15.3% |
-24.2% |
|
Lassen |
$220,000 |
$185,000 |
|
$135,000 |
|
18.9% |
63.0% |
16.7% |
-27.6% |
|
Mariposa |
$277,500 |
$369,000 |
|
$290,000 |
|
-24.8% |
-4.3% |
-23.1% |
11.1% |
|
Mendocino |
$394,500 |
$377,000 |
|
$379,000 |
|
4.6% |
4.1% |
24.1% |
24.1% |
|
Mono |
$800,000 |
$765,000 |
|
$780,000 |
|
4.6% |
2.6% |
-72.7% |
-57.1% |
|
Nevada |
$412,500 |
$382,000 |
|
$430,000 |
|
8.0% |
-4.1% |
56.4% |
-5.4% |
|
Plumas |
$287,500 |
$258,500 |
|
$353,000 |
|
11.2% |
-18.6% |
8.3% |
85.7% |
|
Shasta |
$285,000 |
$285,000 |
|
$242,500 |
|
0.0% |
17.5% |
36.5% |
20.1% |
|
Siskiyou |
$205,000 |
$224,500 |
|
$226,350 |
|
-8.7% |
-9.4% |
150.0% |
12.5% |
|
Sutter |
$310,000 |
$292,500 |
|
$281,000 |
|
6.0% |
10.3% |
5.2% |
-29.1% |
|
Tehama |
$315,000 |
$224,500 |
|
$222,500 |
|
40.3% |
41.6% |
16.7% |
44.1% |
|
Tuolumne |
$315,000 |
$299,000 |
|
$292,500 |
|
5.4% |
7.7% |
64.9% |
-29.9% |
|
Yolo |
$450,000 |
$424,920 |
r |
$422,500 |
|
5.9% |
6.5% |
36.8% |
-9.8% |
|
Yuba |
$290,000 |
$256,000 |
|
$277,900 |
|
13.3% |
4.4% |
37.7% |
-5.2% |
r = revised
NA = not available
March 2019 County Unsold Inventory and Days on Market
(Regional and condo sales data not seasonally adjusted)
|
March 2019 |
Unsold Inventory Index |
Median Time on Market |
||||||||
|
State/Region/County |
March 2019 |
Feb. 2019 |
|
March 2018 |
|
March 2019 |
Feb. 2019 |
|
March 2018 |
|
|
Calif. Single-family home |
3.6 |
4.6 |
|
2.9 |
|
25.0 |
33.0 |
|
16.0 |
|
|
Calif. Condo/Townhome |
3.3 |
4.1 |
|
2.3 |
|
24.0 |
28.0 |
|
12.0 |
|
|
Los Angeles Metro Area |
4.1 |
5.5 |
3.4 |
|
33.0 |
42.0 |
|
22.0 |
|
|
|
Central Coast |
4.1 |
5.5 |
|
3.7 |
|
26.0 |
49.0 |
|
20.0 |
|
|
Central Valley |
3.0 |
3.8 |
|
2.6 |
|
22.0 |
29.0 |
|
14.0 |
|
|
Inland Empire |
4.2 |
5.5 |
|
3.7 |
|
42.0 |
48.0 |
|
29.0 |
|
|
San Francisco Bay Area |
2.6 |
3.3 |
|
1.9 |
|
16.0 |
20.0 |
|
12.0 |
|
|
|
|
|
|
|
|
|
|
|
|
|
|
San Francisco Bay Area |
|
|
|
|
|
|
|
|
|
|
|
Alameda |
2.2 |
2.7 |
|
1.5 |
|
13.0 |
15.0 |
|
11.0 |
|
|
Contra Costa |
2.6 |
3.5 |
|
1.9 |
|
14.0 |
15.0 |
|
10.0 |
|
|
Marin |
3.8 |
3.7 |
|
2.8 |
|
28.0 |
49.0 |
|
20.5 |
|
|
Napa |
6.8 |
5.8 |
|
4.1 |
|
73.0 |
49.0 |
|
34.0 |
|
|
San Francisco |
1.8 |
2.8 |
|
1.6 |
|
14.0 |
15.0 |
|
14.0 |
|
|
San Mateo |
2.2 |
2.9 |
|
1.6 |
|
13.0 |
13.0 |
|
11.0 |
|
|
Santa Clara |
2.3 |
3.1 |
|
1.5 |
|
12.0 |
12.0 |
|
8.0 |
|
|
Solano |
2.8 |
3.8 |
|
2.3 |
|
37.0 |
43.5 |
|
29.0 |
|
|
Sonoma |
4.1 |
4.2 |
|
2.6 |
|
43.5 |
65.0 |
|
29.0 |
|
|
Southern California |
|
|
|
|
|
|
|
|
|
|
|
Los Angeles |
3.8 |
5.1 |
|
3.0 |
|
25.0 |
35.0 |
|
17.0 |
|
|
Orange |
4.3 |
5.9 |
|
3.2 |
|
25.0 |
42.0 |
|
14.0 |
|
|
Riverside |
4.3 |
5.6 |
|
3.6 |
|
44.0 |
45.0 |
|
28.0 |
|
|
San Bernardino |
4.1 |
5.4 |
|
3.7 |
|
40.0 |
56.0 |
|
31.0 |
|
|
San Diego |
3.4 |
4.3 |
|
2.9 |
|
19.0 |
22.0 |
|
12.0 |
|
|
Ventura |
5.8 |
6.7 |
|
4.5 |
|
51.0 |
59.0 |
|
41.0 |
|
|
Central Coast |
|
|
|
|
|
|
|
|
|
|
|
Monterey |
4.2 |
5.6 |
|
3.8 |
|
27.0 |
51.0 |
|
21.0 |
|
|
San Luis Obispo |
4.5 |
6.0 |
|
3.8 |
|
33.0 |
42.0 |
|
23.0 |
|
|
Santa Barbara |
3.9 |
5.5 |
|
3.9 |
|
26.0 |
49.0 |
|
30.0 |
|
|
Santa Cruz |
3.6 |
4.1 |
|
2.9 |
|
20.0 |
55.5 |
|
12.0 |
|
|
Central Valley |
|
|
|
|
|
|
|
|
|
|
|
Fresno |
3.4 |
4.9 |
|
2.7 |
|
26.0 |
24.0 |
|
13.0 |
|
|
Glenn |
2.8 |
4.5 |
|
5.1 |
|
45.0 |
11.0 |
|
39.5 |
|
|
Kern |
3.0 |
4.0 |
|
3.2 |
|
21.0 |
31.0 |
|
20.0 |
|
|
Kings |
3.8 |
4.1 |
|
2.8 |
|
34.0 |
29.0 |
|
25.0 |
|
|
Madera |
6.1 |
4.9 |
|
4.5 |
|
37.0 |
51.5 |
|
31.5 |
r |
|
Merced |
4.3 |
5.3 |
|
3.1 |
|
55.0 |
44.0 |
|
23.5 |
r |
|
Placer |
2.7 |
3.2 |
|
2.4 |
|
17.5 |
28.5 |
|
11.0 |
|
|
Sacramento |
2.3 |
2.8 |
|
2.1 |
|
18.0 |
27.0 |
|
11.0 |
|
|
San Benito |
4.0 |
5.3 |
|
2.7 |
|
63.0 |
24.0 |
|
27.0 |
|
|
San Joaquin |
3.2 |
3.9 |
|
2.2 |
|
22.0 |
31.0 |
|
14.0 |
|
|
Stanislaus |
2.8 |
3.4 |
|
2.4 |
|
23.0 |
33.0 |
|
12.0 |
|
|
Tulare |
3.3 |
5.0 |
|
3.3 |
|
32.0 |
34.5 |
|
29.0 |
|
|
Other Calif. Counties |
|
|
|
|
|
|
|
|
|
|
|
Amador |
NA |
NA |
|
3.9 |
|
NA |
NA |
|
52.0 |
|
|
Butte |
1.8 |
2.0 |
|
2.9 |
|
9.0 |
8.0 |
|
15.5 |
|
|
Calaveras |
5.0 |
4.3 |
|
4.7 |
|
53.5 |
51.0 |
|
46.0 |
|
|
Del Norte |
12.4 |
11.5 |
|
5.8 |
|
140.0 |
111.0 |
|
112.0 |
|
|
El Dorado |
4.2 |
5.5 |
|
3.3 |
|
32.5 |
42.0 |
|
24.0 |
|
|
Humboldt |
4.5 |
6.6 |
|
5.1 |
|
44.0 |
34.0 |
|
24.0 |
|
|
Lake |
8.8 |
6.6 |
|
6.4 |
|
80.5 |
76.0 |
|
41.5 |
|
|
Lassen |
5.2 |
6.2 |
|
4.5 |
|
90.0 |
114.0 |
|
91.0 |
|
|
Mariposa |
10.4 |
6.8 |
|
10.4 |
r |
31.0 |
36.0 |
|
22.0 |
r |
|
Mendocino |
11.1 |
12.6 |
|
11.8 |
|
81.0 |
83.0 |
|
51.0 |
|
|
Mono |
22.7 |
6.5 |
|
10.1 |
|
71.0 |
198.0 |
|
194.0 |
|
|
Nevada |
3.9 |
5.4 |
|
3.1 |
|
44.5 |
50.5 |
|
21.0 |
|
|
Plumas |
9.2 |
9.2 |
|
14.5 |
|
129.0 |
143.0 |
|
185.5 |
|
|
Shasta |
3.7 |
4.7 |
|
4.7 |
|
40.0 |
34.0 |
|
24.0 |
|
|
Siskiyou |
5.8 |
13.7 |
|
5.5 |
|
82.0 |
76.0 |
|
43.5 |
|
|
Sutter |
2.5 |
2.3 |
|
2.2 |
|
14.0 |
39.5 |
|
18.0 |
|
|
Tehama |
3.7 |
4.0 |
|
6.1 |
|
43.0 |
56.0 |
|
68.0 |
|
|
Tuolumne |
5.4 |
7.9 |
|
3.3 |
|
76.5 |
97.0 |
|
36.0 |
|
|
Yolo |
3.0 |
3.6 |
|
2.5 |
|
27.0 |
22.0 |
|
10.5 |
|
|
Yuba |
2.8 |
3.7 |
|
2.7 |
|
19.0 |
39.0 |
|
29.0 |
|
r = revised
NA = not available
Featured Articles
March
14
14
Home sweet home.
If your thinking of selling the best thing to do is call a Realtor, we have several on site and we are open 7 days a week. Sunshine Properties Real Estate 760-728-8855

March
14
14
GRILLED CALIFORNIA AVOCADO MANGO PANINI
GRILLED CALIFORNIA AVOCADO MANGO PANINI
Dara Michalski 02 / 20 / 2019
Before I made these panini, it had pro...
March
14
14
Renters lack financial knowledge to buy
March 7, 2019
California renters qualify for homeownership but lack financial knowledge to purchase, C.A.R. reports
LOS ANGELES (March 7) – While low affordability is the biggest obstacle most renters face in becoming homeowners, 14 percent of California renters can afford to purchase a home but are foregoing homeownership partly because they don't have the financial knowledge to do so, according to research findings by the CALIFORNIA ASSOCIATION OF REALTORS® (C.A.R.).
Of the nearly 6 million California renters statewide*, 826,000 could qualify to purchase a median-priced home in the county in which they reside. Five in 10 who qualify to purchase a home are white (51.4 percent), 12 percent are Asian, more than one in four is Hispanic (26.9 percent), and 6 percent are black.
A lack of financial literacy is one of the biggest barriers preventing renters from becoming h...
March
6
6
Avocado Monthly www.avocadomonthly.com
Variety Packs
We offer 4 different subscriptions: 1-month, 3-months, 6-months, & 12-months. A year's subscription allows you to enjoy all 16 of our varieties, where you can keep track of their different tastes, & textures each offer. Some varieties only produce every other year and even some that only set and produce every 3rd year (this being why they are not commercially viable.) The Hass consistently sets an average crop every year. It has a very long marketing season from January thru September and it handles perfectly not bruising and can be stored in cold storage...